By Kent R. Kroeger (Source: NuQum.com; May 8, 2019)
My previous essay investigated whether tropical cyclones since 1960 have grown more intense. Admittedly, my finding that the minimum central pressure of the average tropical cyclone was dropping by .09 millibars (mb) every year was exploratory. I am a statistician, not a climatologist — which means I’m comfortable enough with climate data to do real damage.
Intellectual limitations aside, my earlier conclusion is consistent with other climatological studies whose models predict a higher frequency of high-intensity storms in the South Indian Ocean, the Northern Atlantic and worldwide.
My motive for analyzing National Oceanic and Atmospheric Administration’s (NOAA) International Best Track Archive for Climate Stewardship (IBTrACS) tropical cyclone data was not about challenging climate science, but rather a demonstration of how much high-quality, globally comprehensive climate data is available to the public for analysis.
And to confirm, to my own satisfaction, many of claims being made by climate researchers regarding tropical cyclones.
To the credit of the climate science community, they put their data online. They don’t hide it. And when they systematically adjust it for historical inaccuracies and systematic measurement errors, they document it. Climate science isn’t a secret society and they aren’t hiding anything substantive from public scrutiny.
So when critics of my storm intensity article were actual, PhD-minted climatologists, not just amateur schleps like myself, I took notice.
According to one climatologist critical of my essay, I didn’t properly convey the natural mechanisms involved in tropical cyclone development and intensification which explain why a rapidly warming earth is not experiencing dramatically stronger cyclones (yet). While I did mention how warmer oceans provide more energy for cyclone development (which is true), it is also true that higher atmospheric temperatures create more wind shear which weakens storms. Climatologists, therefore, are not surprised that tropical cyclones have not significantly increased in intensity through the present.
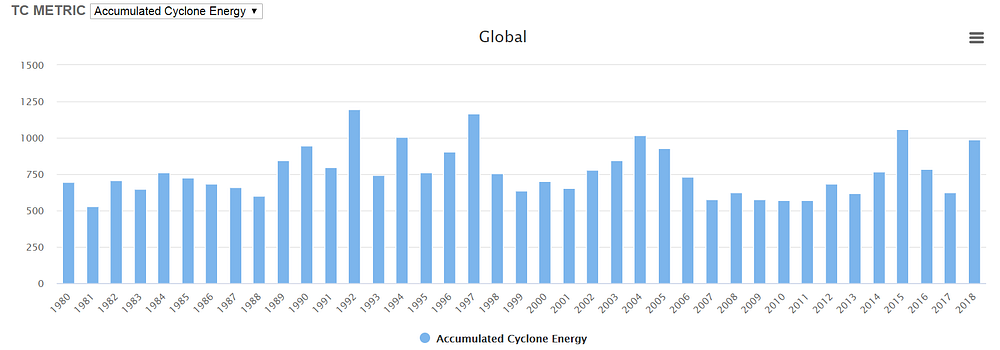
Another critic directed my attention to data compiled by Colorado State University (using the same IBTrACS database I used for my analysis) showing that the annual accumulated cyclone energy (which combines frequency, size and intensity measures of cyclone strength) has not increased worldwide since 1980 (see Figure 1). Again, this is not a surprise to the climate science community.
Figure 1: Global Accumulated Cyclone Energy (Annual)
Finally, one other critic noted that I filtered my tropical cyclone dataset down to storms with sustained winds of at least 39 knots in order to minimize missing pressure data (particularly in the North Indian Ocean basin and for storms in the 1960s); however, I did not impute missing pressure values for the remaining 12 percent of tropical cyclones that still had missing data.
The missing data issue does give me pause as it is one of my consistent complaints about many statistical analyses reported in the popular media. The problem is too important to casually wave off (as I did in my tropical cyclone analysis).
Therefore, I have gone back and re-done my analysis with three major analytic changes: (1) I did not filter out smaller storms below 40 knots, (2) I restricted my analysis to 4,224 storms from the period 1980 to 2018 in order to minimize the occurrence of missing data, and (3) where there was still missing data (12% of storms, n=526), I imputed maximum sustained wind and minimum central pressure for all IBTrACS documented storms using a multiple imputation linear regression model.
For the minimum central pressure missing data model, the predictors were basin, storm duration, and maximum sustained winds (plus random error). For missing maximum wind data, the predictor variables were minimum central pressure, basin, and storm duration (plus random error). In cases where both pressure and wind data were missing (low information cases, n=179), the imputation models included only storm duration and basin (plus random error). Where pressure or wind data were available, the imputation models predicted 90 percent of the variance. For the low information cases, the imputation model predicted just over 30 percent of the variance.
To compare the revised results, Figure 2 shows the original pressure data series with a observed trend of -0.092 mb in minimum central pressure for the average tropical cyclone.
Figure 2: Average Minimum Central Pressure (millibars) per Tropical Cyclone (Without Missing Data Imputation)
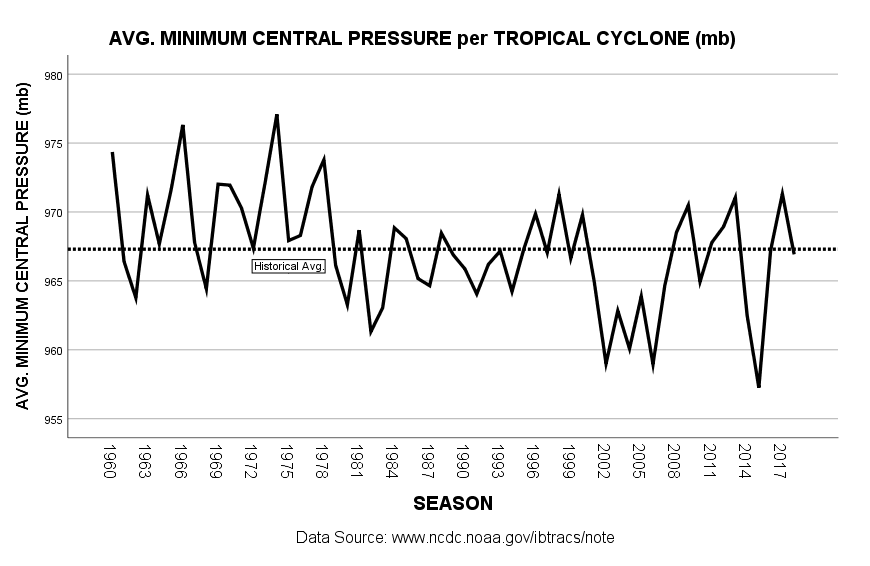
Figure 3 shows the revised data series for minimum central pressure (globally) from 1960 to 2018. The revised model — with all missing cases imputed — reveals an even steeper decline per year in average minimum central pressure (b = -0.159). This is not surprising as most of the missing cases were among smaller cyclones occurring in the 1980s.
Figure 3: Average Minimum Central Pressure (millibars) per Tropical Cyclone (With Missing Data Imputation) and linear trend regression

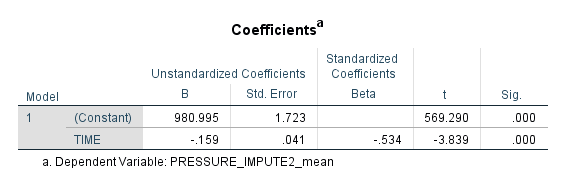
If this linear trend continues, by 2100, the average tropical cyclone will have a minimum central pressure almost 13 mb lower than today. As noted in my previous essay, that can be the difference between a Category 1 storm and a Category 3 storm, though factors other than pressure also impact a storm’s maximum sustained winds.
Nonetheless, according to the linear trend model in Figure 3, tropical cyclones are going to be incrementally stronger over time, assuming the generating process (such as global warming) remains unchanged.
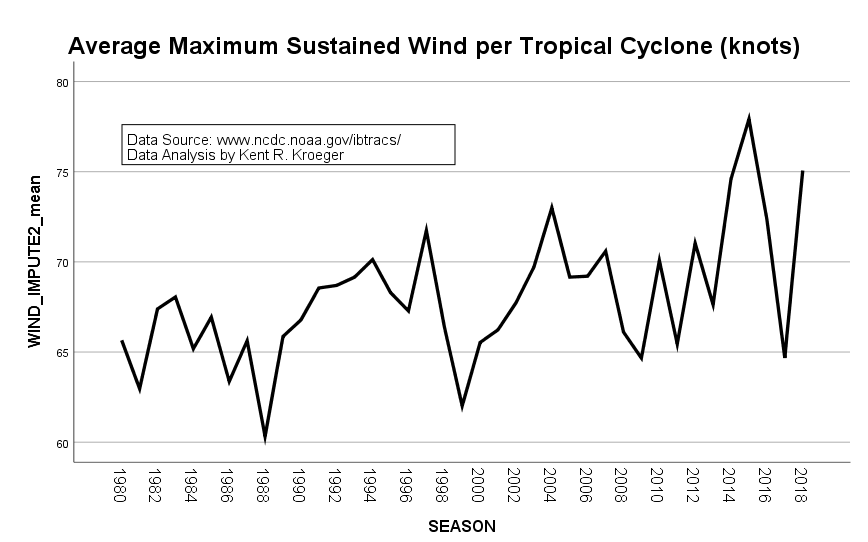
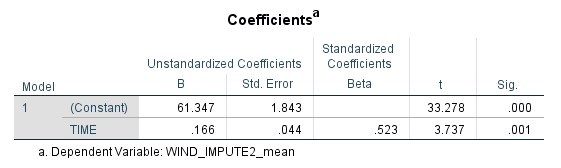
Consistent with decreasing central pressures, maximum sustained winds per storm are also rising (see Figure 4) by 0.166 knots every year. If this linear trend continues, by 2100, the average tropical cyclone will have maximum sustained winds almost 14 knots higher than today.
Figure 4: Average Maximum Sustained Winds (knots) per Tropical Cyclone and linear trend regression
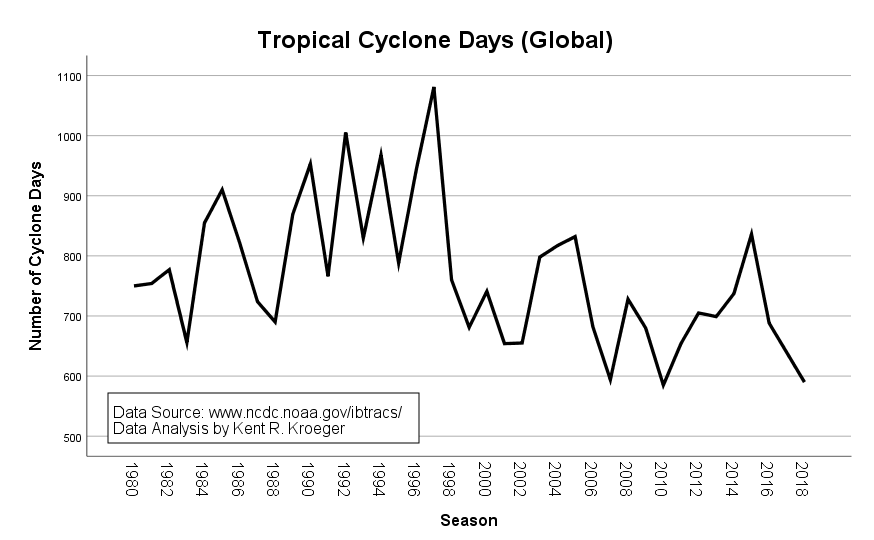
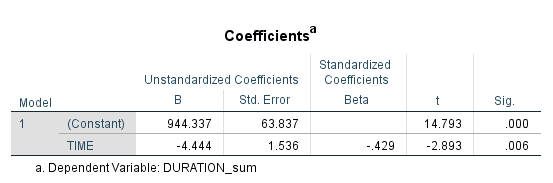
Also consistent with theory and existing research by NASA, the number tropical cyclone days — which is annually a function of the number of tropical storms multiplied by the average cyclone’s lifespan — is declining (see Figure 5). The globe is seeing 4.4 fewer tropical cyclone days each year and if this trend continues, by 2100, the globe will experience 364 fewer cyclone days each year compared to today. That will be over half of the 590 cyclone days the global experienced in 2018.
Figure 5: Tropical Cyclone Days Annually (1980 to 2018) and linear trend regression
But the IBTrACS data reveals something else. Tropical cyclones are not just getting more intense, they may also be getting bigger.
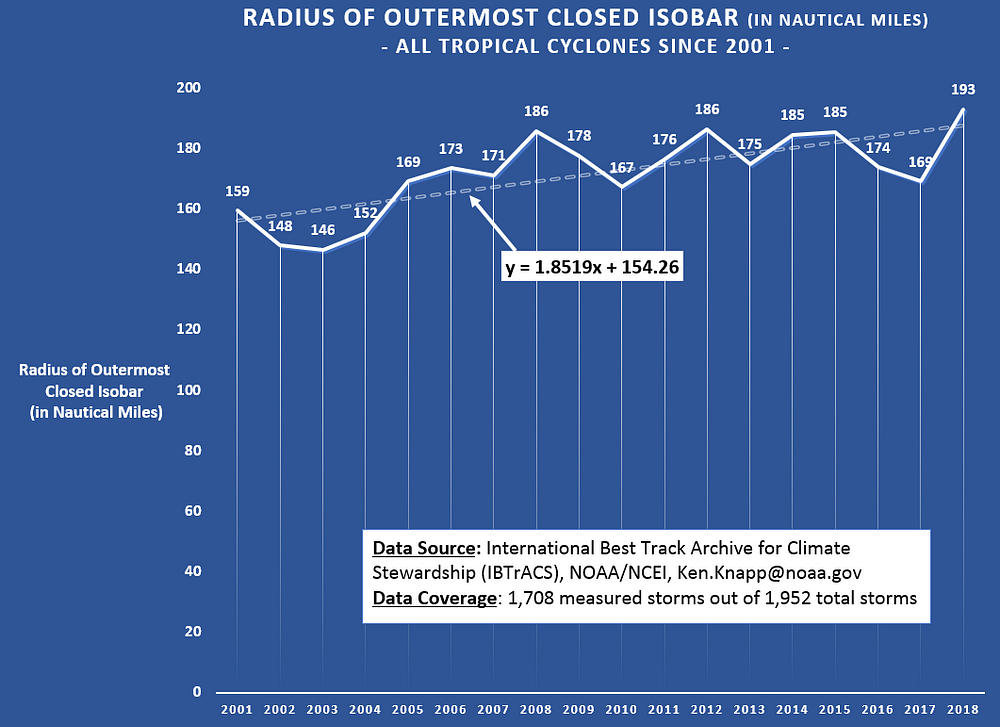
With the strong caveat that there is significantly more missing data with the storm size parameters in the IBTrACS database, an exploratory analysis of the radius of the outermost closed isobar (ROCI) and the radius of maximum winds (RMW) indicates, since 2001, tropical cyclones may be getting larger.
Though the trend does not achieve statistical significance, the average tropical cyclone’s ROCI may be growing by 1.85 nautical miles per year worldwide (see Figure 6). By 2100, the average tropical cyclone could be wider by about 155 nautical miles — about one and a half Long Islands (NY) — and almost double the size of an average tropical cyclone today.
Figure 6: Average Radius of Outermost Closed Isobar (in nautical miles)
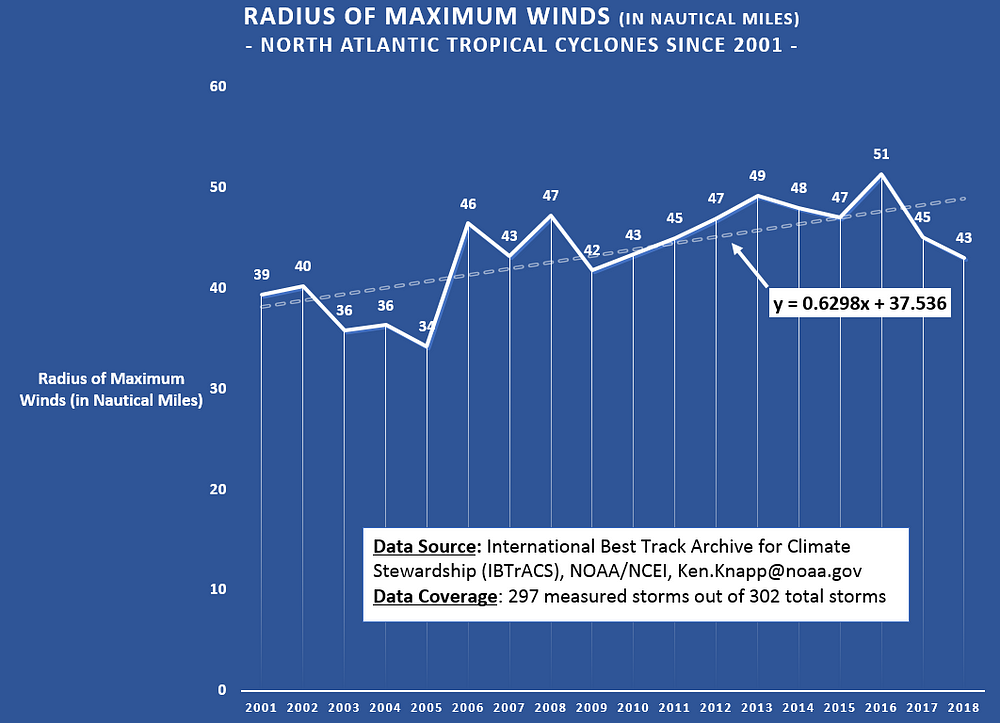
Similarly, within the North Atlantic basin where more complete data is available in IBTrACS, the radius of maximum winds for the average storm may be growing by 0.63 nautical miles each year — more than double the RMW of an average tropical cyclone today (see Figure 7). Again, this trend is not statistically significant, but possibly indicative of a longer term trend that would be in line with current theory and forecasts regarding global warming’s impact on tropical cyclones.
Figure 7: Average Radius of Maximum Winds (in nautical miles)
What does this all mean?
First, of all the assertions made in the mainstream media about climate change, much of it inaccurate, speculative and over-dramatized, we should not discount the real changes we are witnessing in the global occurrence of tropical cyclones. These storms may be less frequent, but they are getting stronger and bigger.
Second, my analysis here is simply modeling the behavior over time of selected tropical storm metrics, not the underlying causal mechanisms generating these trends. The strong assumption accompanying this approach is that the generating process behind each trend is constant and will persist into the future. That is not likely to be the case. Global warming is not a linear process and its impact over time is not either.
Finally, this non-peer-reviewed research on my part treats tropical storms as a singular phenomenon, which is a substantial over-simplification.
“You have to remember that storms aren’t one-dimensional,” according to NASA climatologist Dr. Anthony Del Genio. “There are many types of storms, and sorting out how aspects of each type respond to warming is where the science really gets interesting.”
The real research is going on at that level and explicitly modeling the impact of a warming planet on these complex meteorological phenomena.
What I am comfortable concluding from a statistical perspective, using data vetted by the climate science community, is that tropical cyclones are changing in frequency, size and intensity. Whether these trends continue and how these trends might change are the questions challenging climate scientists going forward.
- K.R.K.
Additional information
Good online resources for current climate science research are the following:
NASA Goddard Institute for Space Studies: https://www.giss.nasa.gov/
AGU Publications: https://agupubs.onlinelibrary.wiley.com/
NOAA Climate Resources: https://www.noaa.gov/climate
UN Intergovernmental Panel on Climate Change (IPCC) Online Report Library: https://www.ipcc.ch/reports/