By Kent R. Kroeger (Source: NuQum.com; January 23, 2019)
President Donald Trump has pinned the argument for building a wall along the U.S.-Mexican border on the existence of an immediate and worsening crisis.
“There is a humanitarian and security crisis on our southern border that requires urgent action,” said President Trump during his January 8th Oval Office address.
As for evidence, President Trump used his speech to focus on drugs, crime and human trafficking: “Thousands of children are being exploited by ruthless ‘coyotes’ and vicious cartels and gangs…Every week, 300 of our citizens are killed by heroin alone, 90 percent of which floods across our southern border…In the last two years, ICE officers made 266,000 arrests of aliens with criminal records.”
“The crisis is not going away,” the Secretary of Homeland Security Kirstjen Nielsen tweeted after President Trump’s speech. “It is getting worse.”
Even the reflexively anti-Trump press judged most of his facts in Trump’s speech as accurate, if somewhat out of context.
Coming out of the speech, the Trump administration’s latest argument for the ‘Wall’ almost entirely ignores actual illegal immigration numbers — because if it did, the facts would not support the ‘crisis’ argument.
Southwest Border Apprehensions are a Proxy for Illegal Immigration
No single statistic can capture the myriad and complexity of issues underlying illegal immigration into the U.S. For one, most illegal immigrants do not travel across our Southwest border.
The U.S. Department of Homeland Security (DHS) reported in August 2018 that “there were 52,656,022 in-scope non-immigrant admissions to the United States through air or sea Ports of Entry (POEs) with expected departures occurring in FY 2017; the in-scope admissions represent the vast majority of all air and sea non-immigrant admissions.”
Among those in-scope admissions, DHS determined there was an overstay rate of 1.33 percent, or 701,900 overstay events. In comparison, U.S. Customs and Border Protection (CBP) reported there were 303,916 Southwest border apprehensions in that same period.
But border apprehensions counts are not analytically useless. To the contrary, research published by the National Institutes of Health has shown the CBP border apprehension statistical series is significantly correlated with media coverage and public opinion associated with immigration.
Border apprehensions covary with broader national immigration trends even if they don’t account for every case of illegal immigration.
To be sure, as an endogenous function of three broad forces — immigration enforcement effort, attempted illegal entries, and the availability of alternative paths for illegal entry —the border apprehensions series is a biased volumetric estimate of total illegal immigration.
Nonetheless, with statistical adjustments, researchers still use it as an instrument for assessing illegal immigration over time because it tracks closely with periods in U.S. history when illegal immigration was known to be high (e.g., mid 1980s and late 1990s; see Figure 1 below).
As to the question posed earlier in this essay — is there an immigration crisis in the U.S. today? — if we look at Southwest border apprehensions as a proxy for illegal immigration overall, the U.S. is experiencing levels today comparable to the early 1970s, a time when illegal immigration did not register as an important issue among Americans.
Evident about Southwest border apprehensions is that it has varied significantly in the last 55 years and most of that variation appears related to economic conditions, immigration policy changes, and periods of strong immigration enforcement efforts.
An Historical Perspective
As he signed the 1965 Immigration and Nationality Act (INA), the country’s most impactful immigration legislation in the last 50 years, President Lyndon Johnson remarked:
“This bill we sign today is not a revolutionary bill. It does not affect the lives of millions. It will not restructure the shape of our daily lives.”
He was wrong on all three counts.
The INA was revolutionary, it affected millions of lives, and it fundamentally restructured American life through its impact on illegal immigration into the U.S.
The INA eliminated national origin, race, and ancestry as the basis for immigration.
When the INA took affect in 1968 until 1986, the year the INA was supplanted by the Immigration Reform and Control Act (IRCA), Southwest border apprehensions increased from 96,641 to 1,615,844 per year. In relative terms, apprehensions went from the equivalent of 0.1 percent to 0.7 percent of the U.S.population.
After enactment of the IRCA, apprehensions dropped significantly, only to rebound to near all-time highs in the mid and late 1990s as the American economy rebounded from the 1990–91 recession.
With the 9/11 terrorist attacks in 2001, however, border security enforcement once again became a salient issue with policy makers, and apprehension numbers fell accordingly.
Figure 1: The Five Era’s Defining Illegal Immigration into the U.S. since 1960

Figure 1 shows that year-to-year fluctuations in Southwest border apprehensions (the red-dashed line) can be divided into five distinct eras:
(1) The 1965 Immigration and Nationality Act–era (Policy) — a period when national-origin quotas were repealed, and a visa system for family reunification and skills was initiated.
(2) The Reagan Economic Boom-era (Economics) — a period when U.S. employers’ demand for low-wage, low-skill workers increased substantially
(3) The IRCA-era (Policy) — a reaction to the rapid influx of low-wage workers from Mexico and Central America in which laws were enacted to sanction companies for knowingly hiring illegal aliens. The IRCA also provided amnesty to illegal aliens already living in the U.S.
(4) The Clinton Economic Boom-era (Economics) — another period of increased illegal immigration concurrent with a fast growing U.S. economy and a high demand for low-wage workers.
(5) Post-9/11-era (Enforcement) — the most recent period marked by enhanced enforcement of U.S. borders (not just the Southwest border) on the basis of national security. This period has witnessed a prolonged and steady decline of Southwest border apprehensions up through 2017.
These five eras appear to account for most of the variation in Southwest border apprehensions.
Still, it is unclear if the U.S. is facing an illegal immigration crisis today that warrants the investment into a physical barrier. In fact, history suggests the U.S. is not facing an existential crisis related to illegal immigration, but instead is suffering the aftermath of years under ineffective immigration legislation.
Suspect number one is the 1986 IRCA.
The IRCA was a law designed to stop illegal immigration while at the same time legitimizing those who had entered the U.S. illegally prior to 1986.
“The mass legalization of then-illegal immigrants was traded for the promise that a new program of employer sanctions would destroy the incentive for further mass immigration. That hope proved vain; but if it had never been entertained, IRCA would never have passed,” wrote author Jack Miles in The Atlantic eight years after President Ronald Reagan signed IRCA into law.
Immediately after IRCA become law, there was a significant drop in border apprehensions as illegal immigration enforcement increased and companies dependent on undocumented immigrants had to adjust to the new realities imposed by IRCA. This transition period lasted no more than three years.
In reality, few companies were ever sanctioned for hiring illegal immigrants and, after the initial dip, Southwest border apprehensions rose steadily between 1989 and 2001.
In this time, a surge in what would be labeled ‘McJobs’ became evident. These were low-wage, relatively low-skill jobs required to maintain basic economic necessities — such as food-chain delivery, construction, sanitation, security, etc. — as the U.S. economy transitioned from a manufacturing-based to a service-based economy.
The Bill Clinton presidency offered optimism for working-class Americans during this transition, but planted instead the seeds of economic inequalitywe live with today. The cheap and plentiful supply of labor provided by undocumented immigrants was critical to this transition.
However, with the 9/11 terrorist attacks on New York City and Washington, D.C. in 2001, the American immigration conversation, previously centered on economics, turned its focus to stopping potential terrorists from entering the country.
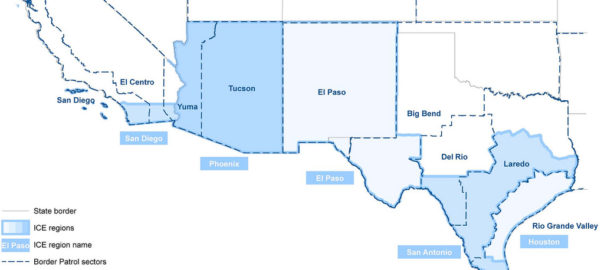
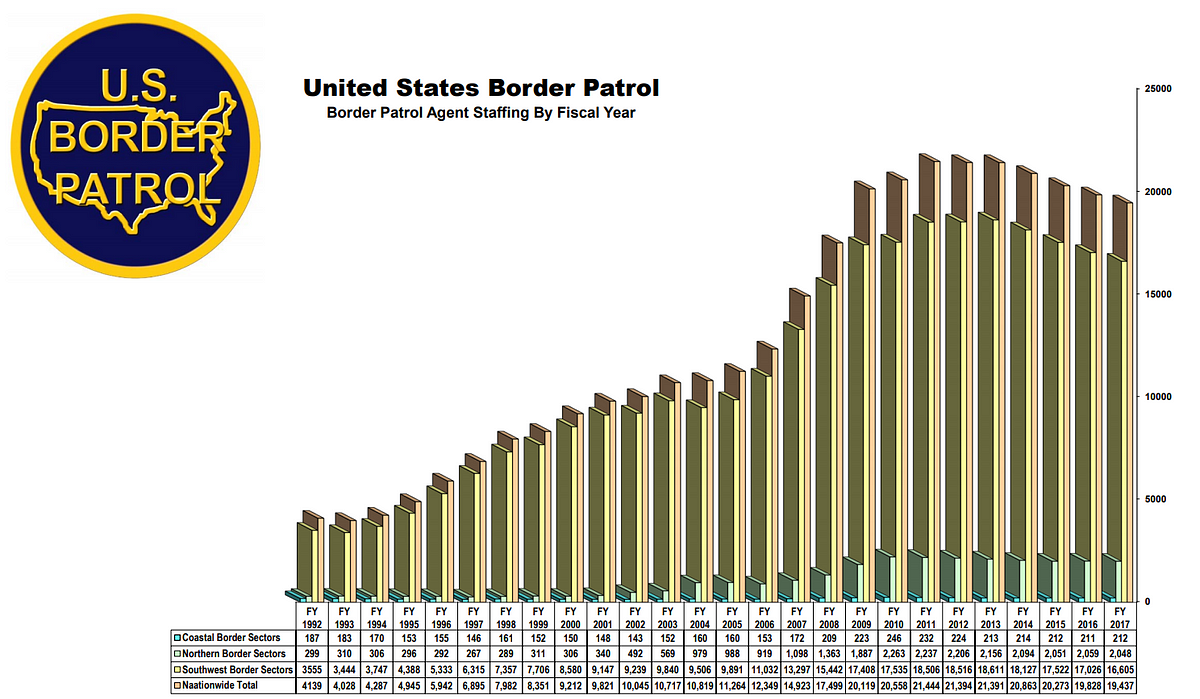
As such, no new law was needed to reduce the influx of illegal immigrants. Instead, the ramping up of border enforcement defined the period from FY2001 to FY2011. In that time, the number of border agents along the Southwest border rose from 9,239 to 21,444 agents — a 132 percent increase.
Concurrently, the number of Southwest border apprehensions declined by 65 percent. Whether this decline was the result of a deterrent effect is difficult to assert given that border apprehensions had been already declining between FY2000 and FY2001. Nonetheless, the decline in border apprehensions since 2000 has occurred sans any new legislation and there is no disputing that CBP enforcement efforts have risen in this same period.
But U.S. immigration levels are not solely a function of public policy or aggressive enforcement. The relative strength of the U.S. economy vis-a-vis the Mexican economy has also been a powerful determinant border apprehensions (see Figure 2).
Figure 2: Relative Economic Conditions between U.S. and Mexico are Related to Southwest Border Apprehensions
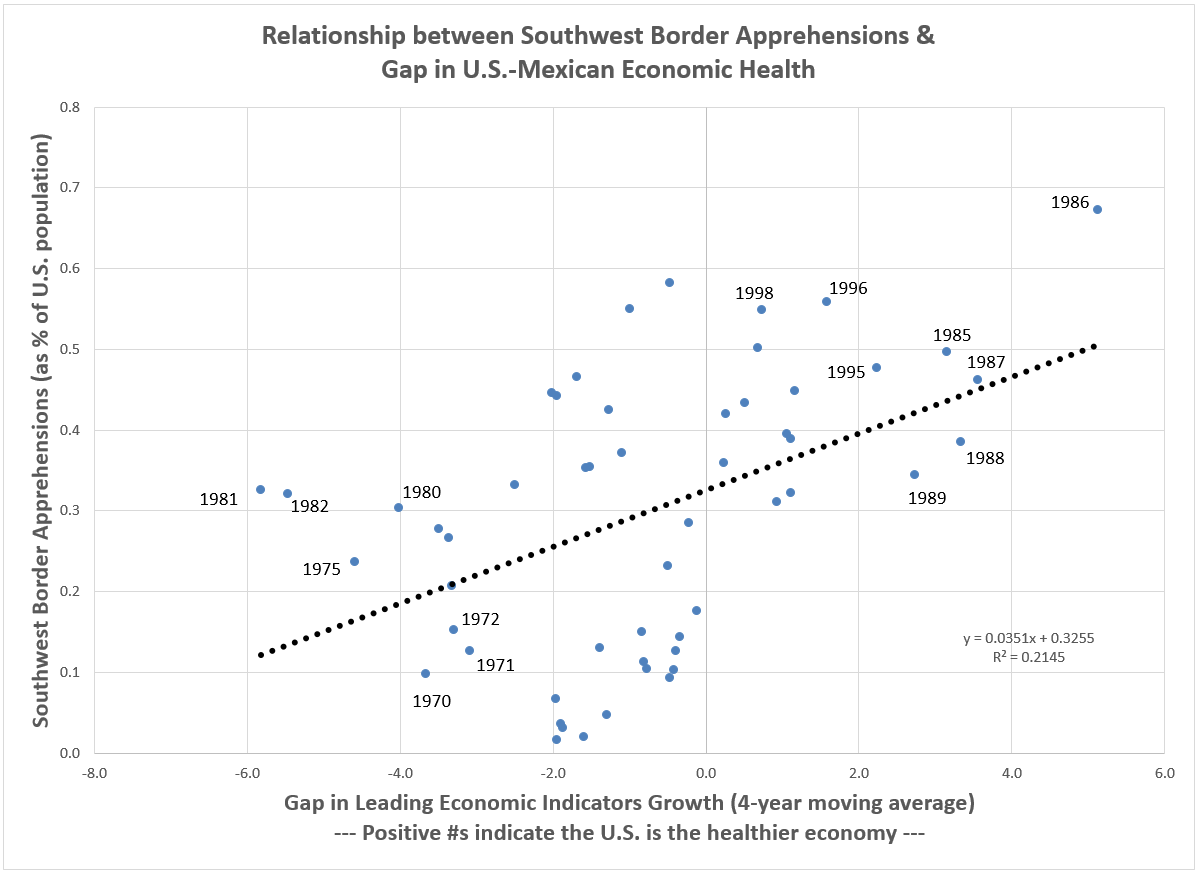
In the above chart, the years in the lower left-hand quadrant (relatively strong Mexican economy / fewer Southwest border apprehensions) are predominately during U.S. recessions (1969–70, 1973–75, 1980, 1981–82), while the years in the upper right-hand quadrant (relatively strong U.S. economy / more apprehensions) are from strong U.S. economic growth periods.
Explaining Southwest Border Apprehensions
Economics, immigration policy, and enforcement are the primary drivers of border apprehensions. But, relatively speaking, is one factor more important than the others or are they similar in their influence?
(Note: Crime, personal security and political oppression are also potential drivers of border apprehensions, but in the time period for the following analysis — 1960 to 2017 — I could not find a reliable measure on these factors that also correlated strongly with border apprehensions. These factors may still be, and probably are, relevant.).
To answer these questions, I obtained annual apprehension data from the CBP from 1960 to 2017 and merged it with macroeconomic data for Mexico, U.S., El Salvador, Guatemala, Honduras, and Nicaragua over the same time frame. Many variables and models were tested, but only the following were used to obtain the results in Figure 3.
The Variables
Dependent variable: Number of annual SW border apprehensions (relative to the size of the U.S. population) (Variable name: SWB_APPS_AS_PCT_POP).
Independent variables:
- Gap in the leading economic indicator growth (4-year moving average) between the U.S. and Mexico (positive values indicate U.S. has healthier economy than Mexico) (Variable name: GAP).
- Step intervention variables for the 1986 IRCA, the 1965 INA and the 9/11 terrorist attacks where the years prior to the intervention are coded ‘0’ and ‘1’ for the year during and years after the intervention (Variable names: Reform1986, INA and Nine11).
- Temporary intervention variable for the three years (1986–88) during which U.S. businesses transitioned to the new immigrant hiring rules established by the 1986 IRCA (Variable name: Reform1986_TRANSITION).
- Time counter where ‘0’ equals 1960, ‘1’ equals 1961, etc. (Variable name: TIME).
- Indicator variables for the Reagan and Clinton administrations where ‘0’ equals ‘No’ and ‘1’ equals‘Yes’ (Variable names: REAGAN, CLINTON).
- Interaction variables for GAP and INA, GAP and Reform1986, and Nine11and TIME (Variable names: GAP_INA, GAP_Reform1986 and Nine11_TIME).
The Results
A more thorough interpretation of the linear model estimation results (AR1corrected using the Cochrane-Orcutt procedure) is available upon request (send email to: kroeger98@yahoo.com).
However, the summary findings are still instructive.
Almost half of the variance in Southwest border apprehensions is accounted for by the linear model (adj. R-squared = 0.49). While not all of the variables achieved statistical significance, the relationships were in the expected direction.
Figure 3: Economics, Policy and Enforcement Drive Southwest Border Apprehensions
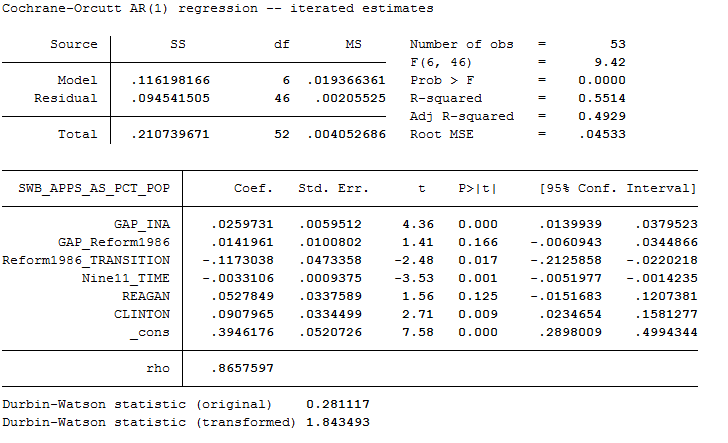
Using standardized coefficients (not shown in Figure 3) for comparisons of the independent variables, it is apparent that the importance of economic factors have varied over time, being most predictive of apprehensions during the INA-era (1965 to 1985). However, apart from the Clinton administration years, periods of relative economic strength in the U.S. after 1985 are not as predictive of border apprehensions as expected by theory and the research literature.
Why? It could be that IRCA, with its threat of sanctions on companies hiring illegal immigrants, altered the dynamic between the U.S. and Mexican economies and illegal immigration. However. few companies have ever been sanctioned under IRCA and it is doubtful that such sanctions would change the incentives for Mexican and Central American migrant workers thinking about attempting illegal entry into the U.S.
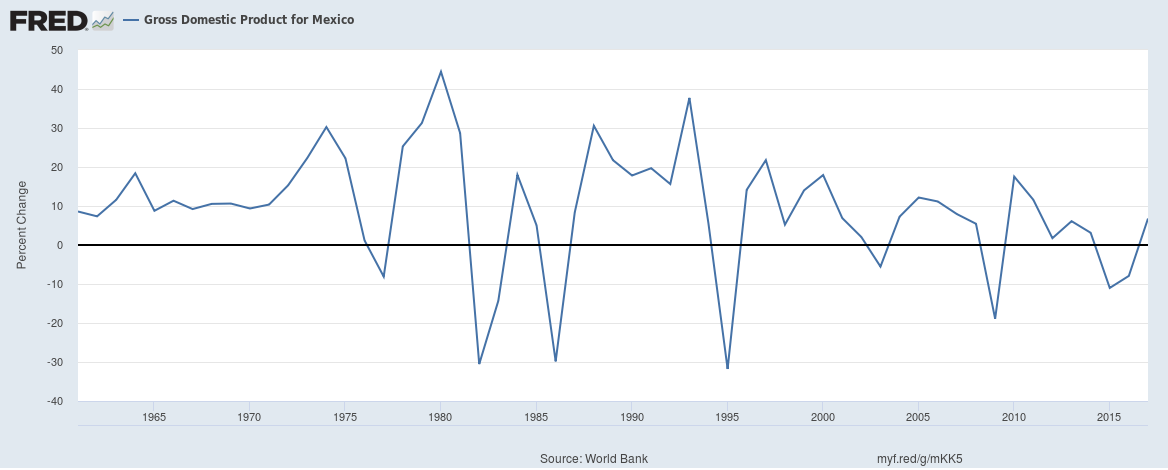
Instead, the variability of the Mexican economy since 1960 seems a more likely suspect (see Figure 4). There was significant variation in Mexico’s GDP growth between 1982 and 1995 with the Mexican economy shrinking by around 30 percent in 1982, 1986, and 1995. At the same time, there was significant growth in between those years. Such extreme variation could make individuals and families less likely to pull up roots and make the trek to the U.S. Whereas, in the 1960s and 1970s, when Mexican GDP growth was generally positive and stable, long-term decisions were perhaps easier to make.
Figure 4: Mexico’s Annual GDP Growth since 1960
Changes in the U.S. economy could also be playing a factor in the reduced importance of economic factors on border apprehensions (see Figure 5). The high growth periods of the 1960s and 1980s have been replaced with longer periods of slower growth in the U.S. economy. This change could be, again, altering the decision calculus among potential immigrants.
Figure 5: U.S. Annual GDP Growth since 1960
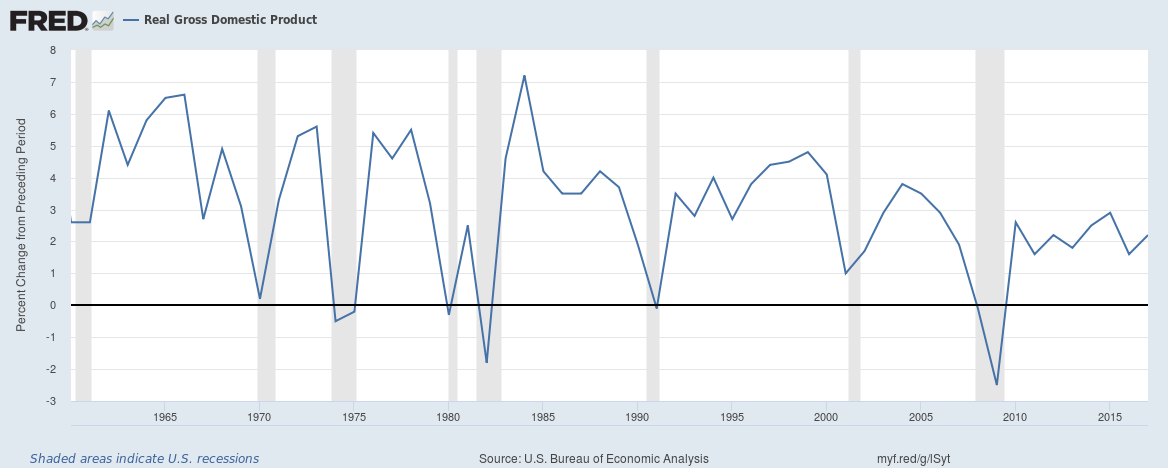
Source: Federal Reserve of St. Louis
Other factors in the linear model showing a significant relationship to border apprehensions are the years following the 9/11 attacks (a negative relationship) and the transition years immediately after passage of the 1986 IRCA (also a negative relationship).
Significant variation remains unexplained by our linear model and, admittedly, incentives for asylum seekers and political refugees to make the trek to the U.S. are not explicitly represented among the variables tested.
Still, the original intent of this essay was to add some comparative context to illegal immigration in order to assess the validity of President Trump’s claim that the U.S. is “facing a crisis on the southern border.”
This claim is simply hard to justify given the trends in the aggregate data. Unquestionably, there are too many individual cases of human trafficking, drug smuggling, and inter-border gang movements to say there is not an illegal immigration problem.
But are these types of illegal acts associated today with historically high levels of illegal immigration along our Southwestern border? The answer is an emphatic ‘No.’
- K.R.K.
Comments and critiques can be sent to: kroeger98@yahoo.com