Questions and press inquiries regarding this article and the data analysis contained within can be directed to: info@olsonkroeger.com or call Kent Kroeger at 515 512 2776
By NuQum.com Analytic Team (Source: NuQum.com, January 5, 2017)
One Los Angeles Times writer called it the “scorched-earth” campaign. Even his critics will agree, Donald Trump’s 2016 presidential campaign was like no other in American political history.
Yes, we’ve had negative campaigns before this one. In the 1828 campaign, John Quincy Adams called Andrew Jackson’s mother a prostitute and Jackson’s wife an adulteress. More recently, George W. Bush’s 2000 primary campaign was accused of indirectly promulgating a rumor among South Carolina Republicans that John McCain had a “black baby” out of wedlock.
But most examples, like those, were ancillary to broader campaign motifs that generally leaned more positive. In 1988, George H.W. Bush’s campaign infamously used the “Willie Horton” ad to accuse his opponent, Michael Dukakis, of being soft on crime. But, even in that election, Bush’s message was much more about “no new taxes” than it was about attacking his opponent.
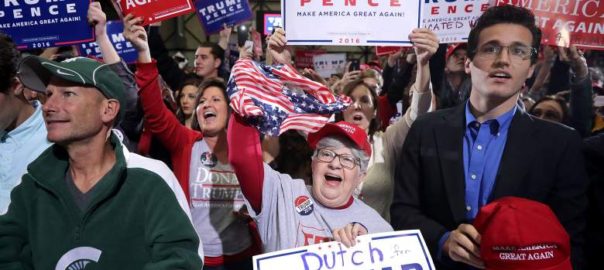
But now comes along Donald Trump who seemed to change the rules of American political campaigns that, heretofore, were assumed to be inviolable. Trump’s most notable deviation was in his ground game, or lack thereof, according to many political campaign experts. Where the political consultants expected door-knockers and phone banks, Trump gave us campaign rallies and more campaign rallies. And not just rallies, but human waves, often more than 10,000 attendees, that strode across cornfields and stadium parking lots, often waiting hours just to see their new political liberator. Trump rallies were events, similar to the atmosphere one experiences while tailgating prior to a Big 10 or SEC football game.
In contrast, Hillary Clinton ran a more traditional campaign that put a much higher premium on advertising and get-out-the-vote efforts than did the Trump campaign. This difference in campaign strategy was, in part, a function of Clinton having more money and a more established campaign organization; but, it was also a function of expectations. Modern presidential campaigns are supposed to look like Hillary Clinton’s campaign. Who needs creativity when you have a proven model for winning presidential elections. Barack Obama didn’t re-create how modern campaigns are structured. He simply did it better than anyone else in 2008 and 2012.
Trump has changed the rules. So what if he was outspent by $600 million. He’d make up for it through free media (euphemistically called “earned media” nowadays by the media) and campaign rallies. He also employed a level of negativity unseen in modern presidential elections.
“(Trump) sketched out conspiracies involving global bankers, casually threatened to jail his political opponent, and warned in increasingly specific terms that a loss by him would spell the end of civilization,” wrote Los Angeles Times writer, Noah Bierman.
Here is an example of a Trump rally in Grand Rapids, Michigan: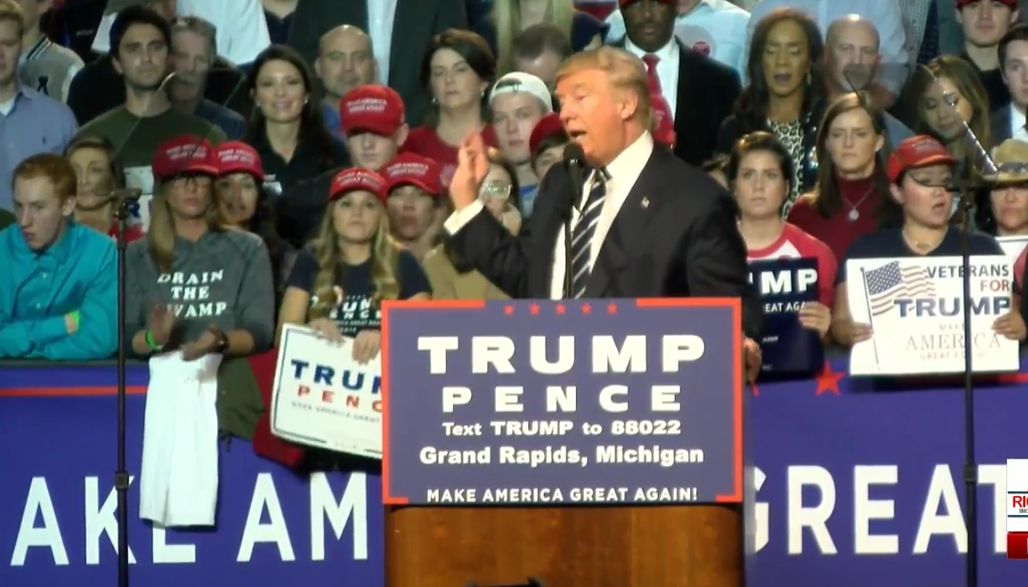
Yes, this campaign was different. But did it really make a difference in the final election outcome?
Using state-level event data from the website www.nationalpopularvote.com and aggregated polling data from RealClearPolitics.com, we analyzed the relationship between the candidates’ travel schedules and changes in their state-level of support.
Since over 95 percent of 2016 candidate events and most state-level polling occurred in just 15 “swing states,” our analysis is restricted to those states (see list of states in table below). The table shows the opinion polling data averages at the state-level at the beginning of October (RCP Poll Avg. as of Oct. 1st,) and the candidate’s actual vote percentage on Election Day (Actual Vote %). The column on the far-right summarizes this information by showing the extent to which Trump’s support changed between Oct. 1st and Election Day. As you can see, in the final month of the campaign, Trump gained support in all by two of the 15 swing states (Colorado and Nevada).
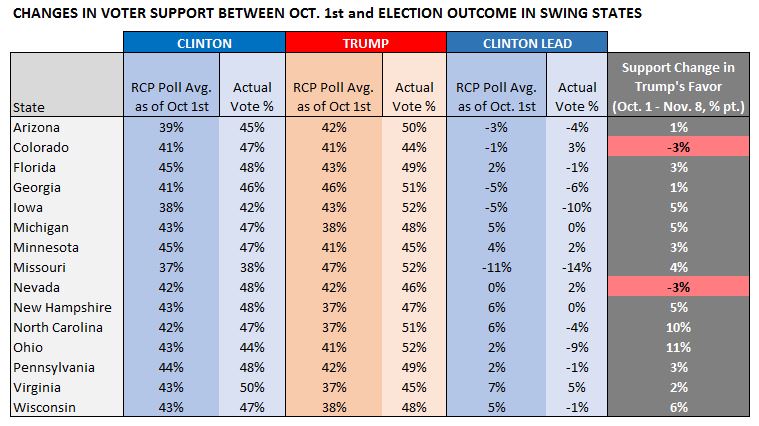
Based on this evidence alone, you might conclude that Trump had the superior campaign. However, it is fair to ask, was this domination simply the result of two exogeneous factors: The Comey letter and the Podesta emails?
If those two factors alone drove Trump’s dominance, we’d expect the impact to be similar across all 15 swing states. After all, voters’ exposure to these two factors come primarily from national media outlets, not local or state-level sources.
Yet, we see from the table above that Trump’s support gains were not evenly distributed across the “swing” states. In fact, there is a lot of state-level variation that warrants explanation.
The next table shows the number of post-convention candidate visits for each of the swing states and the percentage of the eligible voter population that was Hispanic/Latino as of January, 2016. Without formally testing the relationships, it is evident that in states where the Hispanic voting population was large (>10%), Trump did not make significant inroads into Clinton’s early October lead (Arizona +1.1%, Colorado -3.4%, and Nevada -2.6%).
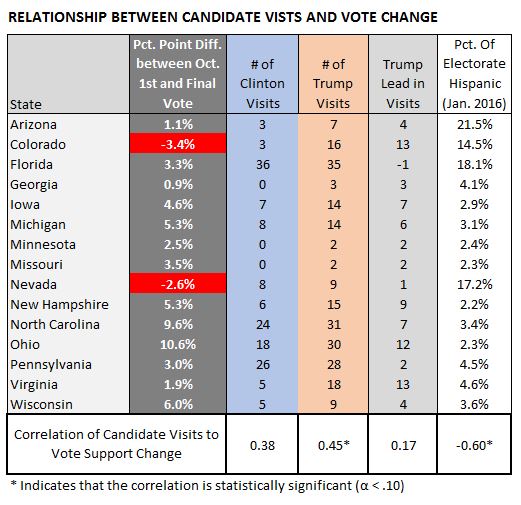
Less evident is the relationship between the number of candidate events and the relative change in Trump’s support. In Ohio, where Trump’s relative position improved by 10.6% between Oct. 1st and Election Day, the Trump campaign had 12 more events than Clinton’s campaign. Yet, in Colorado where Trump’s campaign had 13 more visits, his relative vote position deteriorated by 3.4%. The bivariate correlation (p = 0.45) between the number of Trump campaign events and the size of the Hispanic/Latino population (p = -0.60) with changes in vote support were statistically significant; however, the number of Clinton events and the relative difference in the number of events were not statistically significant in the bivariate correlations. Without a more formal test, it is difficult to know the relative contribution of each factor to changes candidate support.
THE MODEL:
We estimated a linear model to explain the vote change in the 15 “swing” states (the full regression model summary and dataset can be accessed here). We included four variables in the initial regression model: (1) Number of Clinton campaign events in each, (2) Number of Trump campaign events, (3) Percentage of Hispanic/Latinos in the voter eligible population, and (4) a indicator variable for Colorado. Given the small sample size (n=15) it was not feasible to include more than four variables (see the Methodological Note at the end of this article for other issues related to our regression model).
CLICK HERE FOR THE FULL MODEL OUTPUT
The regression model revealed two significant findings. The number of Trump campaign events was significantly related to changes in support for Trump. All else equal, one Trump event translated into an increase of 0.2 percent in Trump’s vote support relative to Clinton’s. Conversely, given the small sample size, the impact of Clinton’s events was too small to be distinguished from zero, though it was negative (-0.17) as expected. The regression also revealed a strong negative relationship between the size of the Hispanic/Latino voter eligible population and changes in voter support for Trump. In Colorado, Trump’s campaign events were particularly ineffectual.
Our model’s implications are summarized in the table below. By setting the Hispanic/Latino population at two levels – 17.8% (for large Hispanic/Latino population states) and 3.2% (for low Hispanic/Latino population states – we analyzed the impact on Trump’s relative vote support given different numbers of Trump campaign visits. In low Hispanic/Latino population states, five Trump events translated into a 3.1 percentage-point increase in his support relative to Clinton’s. Twenty events gave Trump a 5.7 percentage-point bump up in those states.
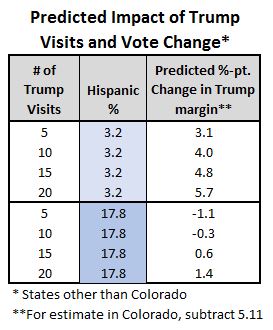
In contrast, in high Hispanic/Latino population states, the impact of Trump events were dampened. It would take more than 10 Trump campaign events to overcome his disadvantage in those states.
A final note, while we did not include the impact of advertising and news coverage in our regression model, we do believe those factors might help explain the intrinsic and pervasive disadvantage Trump had with Hispanic/Latino voters on a national level. Whatever the strategic and tactical flaws in the Clinton campaign overall, it does appear her campaign was very successful at checking Trump’s support gains in states with large numbers of Hispanic/Latino eligible voters.
As for the impact of the Comey Letter or the Podesta emails, that will be left for a more thorough analysis. Again, we do not believe inclusion of these factors would change our state-level findings. Those are national events filtered through national media sources. In our four-variable model, the impact of those factors may be buried in the ‘regression intercept’ which represents the starting point for changes in Trump’s support, setting all other factors to zero. Here, the intercept was estimated to be 3.2. That is, Trump would have gained about a three percentage-points versus Clinton in October even if all other factors — candidate visits and the size of the Hispanic/Latino vote eligible population — were non-factors. If there is a Comey and/or Podesta effect, it is in there somewhere. In a close election, like the last one, those could have been decisive factors, even if they weren’t the biggest determinants of the election outcome.
DISCUSSION:
It is fair to ask, how does a candidate visit change voter opinions (or, more likely, the likelihood that the voter will vote) given that so few people attend a campaign rally? Even Trump rallies attracted only about 5,000 people per event – and most of those people were already Trump supporters. How does a really change an election outcome?
We see it as a multi-stage process powered by word-of-mouth and television coverage. We don’t think many voters change their vote choice because they attended a rally. Instead, based on telephone interviews NuQum.com conducted with Trump supporters in late October in Polk County, Iowa, we heard Trump supporters repeatedly talk about the excitement surrounding the Trump campaign. Had they attended a Trump rally? In all but a few cases, no. Instead, their sense of the excitement came from television coverage and world-of-mouth from family, friends, and work colleagues, some of whom had attended a Trump event. That is a one-two-punch that, anecdotally at least, leads us to believe a single campaign event can indirectly move voters into the voter booth in favor of one candidate over another. It’s a dynamic that we don’t think worked as consistently or as often in the Clinton campaign’s favor.
FINAL THOUGHTS:
Admittedly, our analysis doesn’t address the impact of news coverage and advertising (TV, radio, direct mail). We know those campaign factors matter – a lot. Nonetheless, we can explain over 63 percent of the variation in the state-level vote change during the last month of the campaign by referencing just three variables: The number of Trump visits, the relative size of the Hispanic population in each state and a deflation factor unique to Colorado.
The Clinton campaign spent much more money on advertising, according to Kagan Media; and, we have yet to see an analysis suggesting Clinton’s TV and radio were of a lower quality than Trump’s. In our judgement, Clinton’s TV and radios were qualitatively superior to Trump’s – and we would say, it is not even close. Clinton’s TV spots were brilliantly produced and powerful. As the father of an autistic son, the Clinton spot with the mother of an autistic child lamenting Trump’s mocking of a handicapped New York Times reporter, was as moving as any political ad I’ve ever seen.
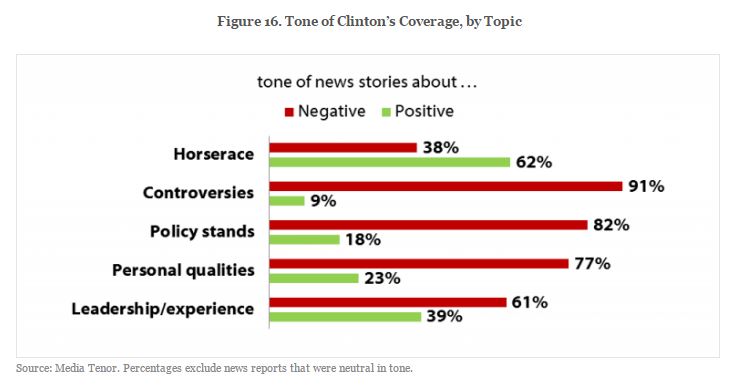
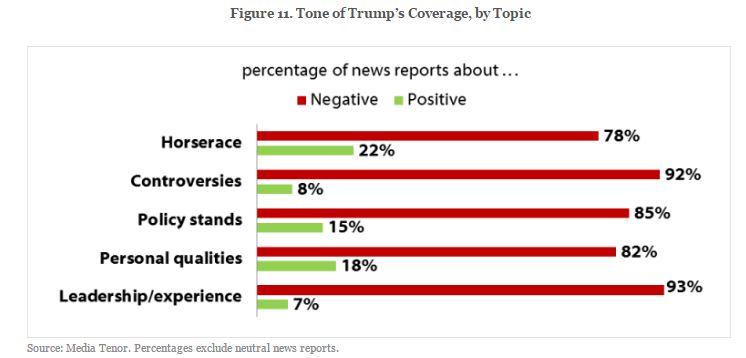
Furthermore, contrary to the current media narrative, Trump’s news media coverage in the general election period was significantly more negative than Clinton’s (see the charts below provided by Harvard’s Shorenstein Center). The ‘horse-race” coverage was particularly tilted in Clinton’s favor.
Thus, we are skeptical that the inclusion of advertising or the tone of media coverage would change our main finding that campaign events were a significant factor in Trump’s electoral college triumph.
Combine the impact of Trump’s rallies with the cold-hearted efficiency of the Trump campaign’s allocation of campaign resources into the key “swing” states, and you get the most improbable electoral victory in US. Presidential history.
Questions and press inquiries regarding this article and the data analysis contained within can be directed to: info@olsonkroeger.com or call Kent Kroeger at 515 512 2776
METHODOLOGICAL NOTES: There are a number of caveats to our analysis. First, we did not include state-level media buys by the two campaigns. Our initial source for media buy data (The University of Maryland’s Center for Political Communication and Civic Leadership) lacked the fidelity we required at the state-level; therefore, we did not formally test for the impact of media buys. However, in the media data we did obtain, the variation between non-swing states and swing states far exceeded variation between each of the 15 swing states. We are confident that the inclusion of the media buy data would not change the results reported here. Second, the candidate event data includes both the presidential nominee visits (Trump, Clinton) and vice-presidential nominee visits (Pence, Kaine). Third, we only have 15 data points (one for each state) making it difficult to discern weaker relationships within the data. For example, we find Clinton campaign visits had no significant impact on voter support. We believe an analysis at the state and weekly levels might better reveal the nature of that relationship.