By Kent R. Kroeger (Source: NuQum.com, March 19, 2018)
{Send comments to: kkroeger@nuqum.com; the SPSS dataset used in this article can also be provided upon request}
According to whistleblowers, a voter profiling company, Cambridge Analytica, started collecting private information in 2014 from more than 50 million Americans through their Facebook profiles. This unauthorized “data breach” represents one of the social media giant’s largest data leaks.
Facebook claiming it was unaware of Cambridge Analytica’s exploitation of Facebook users for the Donald Trump campaign’s targeting of potential voters is a bit like Captain Renault in the movie Casablanca saying, “I am shocked…shocked!..to find that gambling is going on in here!”
Facebook is equally phony. By its own admission in a statement last Friday, the company knew, as early as 2014, what Cambridge Analytica was doing with Facebook users’ profile data and chose to ignore it.
Why? Because it is good for business. Facebook’s business model is built on the premise that the personal information it collects on its users has considerable market value. And Facebook aggressively sells this feature of its service.
Furthermore, any attempt to call what Cambridge Analytica did with its access to Facebook profile data a “data breach” is cynical misuse of the term.
“There was no unauthorized external hacking involved, meaning that Facebook databases were not breached by an outside malicious actor,” according to Ido Kilovaty, a Cyber Fellow at the Center for Global Legal Challenges and Resident Fellow at the Information Society Project, Yale Law School.
Cambridge Analytica simply exploited the Facebook profile data for maximum value. Its innovation was to pull in users’ Facebook friends to expand its analytic base.
The Trump campaign’s voter targeting firm may have pushed boundaries by harvesting 50 million Facebook user profiles to build its own database for communications targeting, but its methods were well-known within Facebook.
Why? Because Barack Obama’s two presidential campaigns pioneered such use of Facebook data to target voters.
Investor’s Business Daily nicely summarizes the 2012 Obama campaign’s methods:
“In 2012, the Obama campaign encouraged supporters to download an Obama 2012 Facebook app that, when activated, let the campaign collect Facebook data both on users and their friends.
According to a July 2012 MIT Technology Review article, when you installed the app, it said it ‘would grab information about my friends: their birth dates, locations, and likes.’
The campaign boasted that more than a million people downloaded the app, which, given an average friend-list size of 190, means that as many as 190 million had at least some of their Facebook data vacuumed up by the Obama campaign — without their knowledge or consent.”
And it should surprise no one that Hillary Clinton’s campaign was doing something similar in building their own voter targeting algorithm, Ada, which also relied on social media content to build its models.
The current hand wringing by the mass media about Facebook’s role in helping the Trump campaign appears to be nothing but another poorly veiled partisan attack on Trump.
Had Clinton won the election, Ada’s algorithms would be legend. Instead, Ada is a monument to Clinton’s over-reliance on Moneyball-inspired data for its decision-making.
In contrast, Cambridge Analytica, because it aided the Trump campaign, is a digital age boogey man meant to instill fear in every red-blooded America who has ever re-posted an anti-Hillary meme on Facebook or ‘liked’ a group page dedicated to protecting the Second Amendment.
The unacknowledged truth is that all of these sophisticated data algorithm’s are somewhere between profound data-driven insights and modern versions of a kabuki dance — a stylized ritual meant to convey legitimacy to the data firms promoting the superior value of data analytics.
Does that mean data analytics are a fraud? No, of course not. It does mean that assigning excessive value to data analytic methods undervalues the real mechanisms behind how people decide their vote preferences.
Too frequently in today’s social science, personified by Cambridge University psychologists, Michal Kosinski and David Stillwell, who helped build the psychological profiling algorithms employed by Cambridge Analytica, interesting correlational relationships substitute for sound insight.
Stillwell, specifically, developed an app for Facebook where users would take a short personality quiz and get a score on five personality traits — Openness, Conscientiousness, Extroversion, Agreeableness and Neuroticism. In exchange for their cooperation, Facebook users would agree to give Stillwell access to their Facebook profiles.
By 2015, Cambridge Analytica, who had signed a contract with Facebook to gain access to Facebook’s users, would leverage Stillwell’s app to develop personality profiles for millions of Facebook users.
Among the unique insights from Cambridge Analytica was that people who liked ‘I hate Israel’ on Facebook also tended to like Nike shoes and KitKats.
Those types of findings are a tell-tale sign of pseudo-intellectual bullshit.
There is no causal social theory that links the purchase of Nike shoes and KitKat bars to antipathy towards Israel. Those types of relationships are “spurious” in that they represent statistically significant correlations in data that fail to account for the true causal factors actually linking variables.
We repeat. Buying Nike shoes or KitKat bars is not a subconscious indicator that you are anti-Israel.
In all probability, the relationship Cambridge Analytica found in their data was either a product of random chance or an artifact of the targeting used in marketing Nike shoes and KitKat bars that may correlate with social subgroups prone to anti-Israel sentiments.
Either way, suggesting a substantive relationship between KitKat bars and anti-Israel sentiments is shitty social theory and bad business practice.
Cambridge Analytica and other mainstream data analytic firms will argue they aren’t in the business of developing solid social theory. What they care about are the deep correlations in data, not the true causal mechanisms behind them. They will defend their methods with the oft repeated academic canard that we are “data rich and theory poor.”
No kidding.
Unfortunately, throwing one’s arms up and giving up on developing good theory does not justify findings like, “the purchase of Nike shoes and KitKar bars correlates with anti-Israel sentiments.”
It is an intellectual cop-out that may explain why so many sophisticated modeling algorithms, like the Clinton campaign’s Ada algorithm, fail in practice.
But there are other reasons supporting skepticism about the big data analytic models like the ones employed in the 2016 presidential campaigns.
The 2016 presidential election results were predictable months in advance of the election itself. In some cases, months before a single general election ad had been purchased by the Clinton or Trump campaigns.
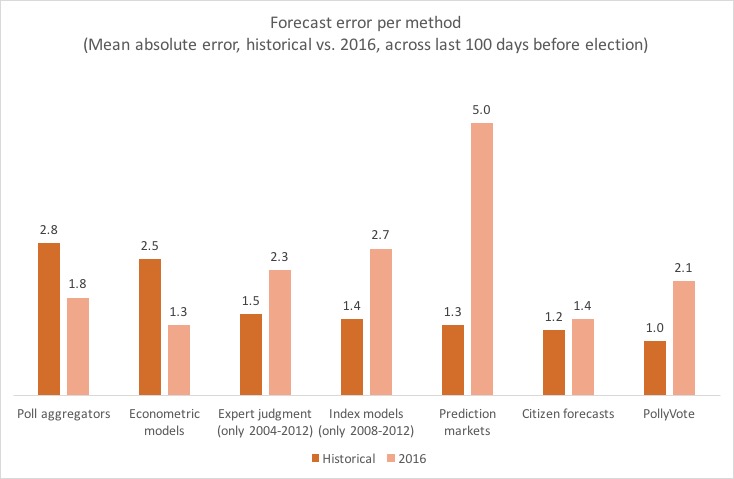
Contrary to the popular myth promoted by the mainstream media, the polls and econometric models were exceptionally accurate in their predictions for the 2016 popular vote. Hillary Clinton won the popular vote by about 3 percentage points and that is very close to what the polls and econometric models predicted on the morning of November 8th.
What failed in 2016 were the prediction markets (i.e., “the experts). The econometric models, which generally rely on economic data gathered months prior to election day, performed particularly well — as usual (see Figure 1 below).
What shocked the system was the degree to which the Clinton vote clustered along the American coastal states and under-performed in the American rust belt.
Had the Clinton campaign recognized her vulnerability in states like Wisconsin, Michigan, and Pennsylvania, the outcome could have been very different. Robby Mook should never be allowed to present himself as a political expert in any forum. Hillary Clinton lost because he was not good at his job.
And it is that type of strategic intelligence that Cambridge Analytica may have maximized using its own data models. Cambridge Analytica identified marginally conservative Americans most vulnerable to voting for Clinton and targeted them for anti-Clinton campaign ads.
NuQum.com has previously shown in its analysis of 2016 American National Election Study (ANES) that older conservatives most engaged in using social media (e.g., Facebook and Twitter) for sharing political information were particularly negative towards Hillary Clinton.
Older conservative voters that used social media for sharing had noticeably different attitudes in the 2016 election
In rating Hillary Clinton on a 0 to 100 favorability scale, on average, “slightly conservative” adults aged 40 or older who used Facebook or Twitter to share political information gave her a rating of 20.7, compared to 32.1 among otherwise similar adults who had not used Facebook or Twitter for sharing political information (see Figure 2 below). A similar relationship emerged among “conservative” adults (aged 40 or older). This pattern did not appear however among adults under 40 years of age, regardless of political ideology.
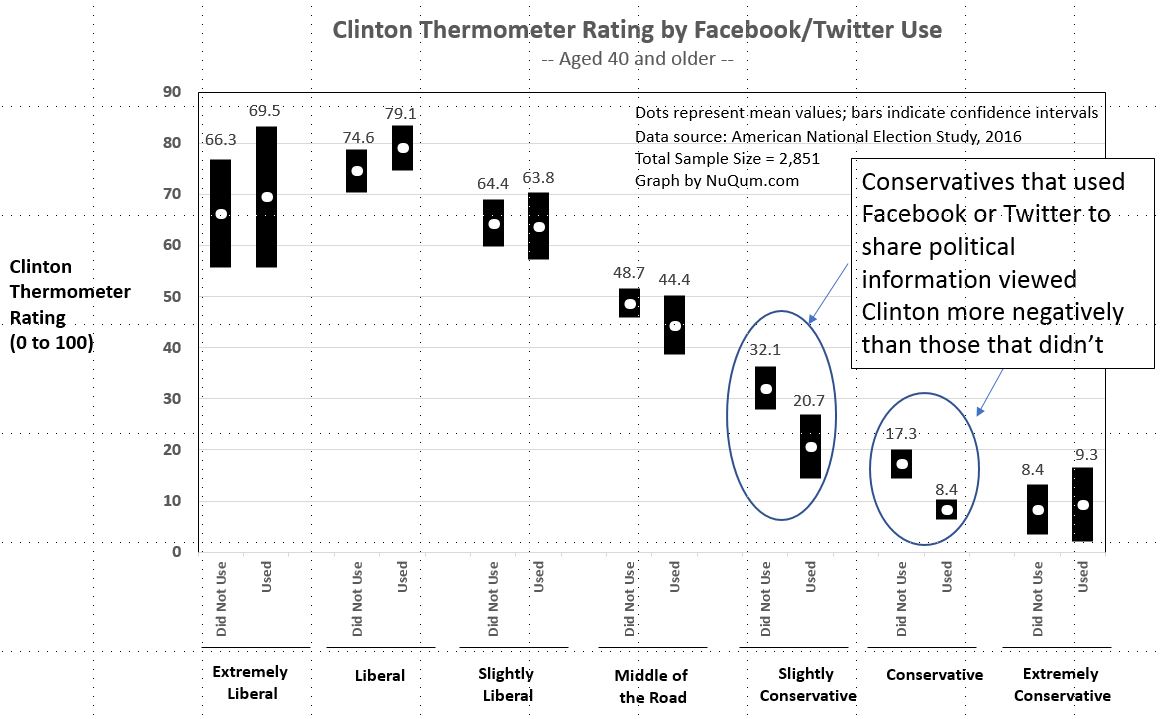
“Slightly conservative” and “conservative” Americans accounted for 25 percent of the U.S. vote eligible population according to the 2016 ANES. And within that 25 percent, just under half of them said they used Facebook or Twitter to share political information during the campaign.
That is still almost 12 percent of the population that had a distinctly more negative view of Clinton by the end of the campaign, compared to other eligible voters with otherwise similar demographic and attitudinal characteristics.
We believe something unique happened to this group during the campaign. We may have prematurely called this evidence of “Russian meddling” but we feel comfortable in calling it the “social media effect” (SME).
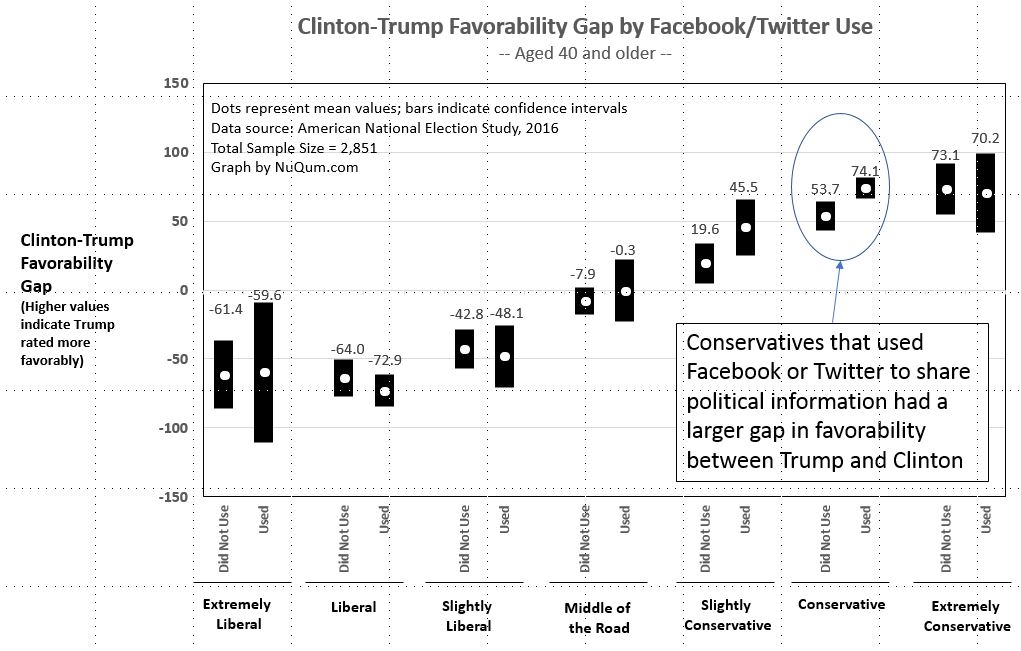
When we looked at the relative difference in favorability towards Clinton and Trump (see Figure 3 below), the same older conservatives appeared to stand out. “Conservatives” (aged 40 or older) that used Facebook and Twitter to share political information were significantly more positive towards Trump, relative to Clinton, than those in the same demographic category but did not use Facebook or Twitter for political information sharing.
When assessing the honesty of the two presidential candidates, “slightly conservative” and “conservative” adults (aged 40 or older) who used Facebook or Twitter for sharing political information thought Trump was much more honest than Clinton than did otherwise similar adults who had not used Facebook or Twitter for political information sharing (see Figure 4 below).
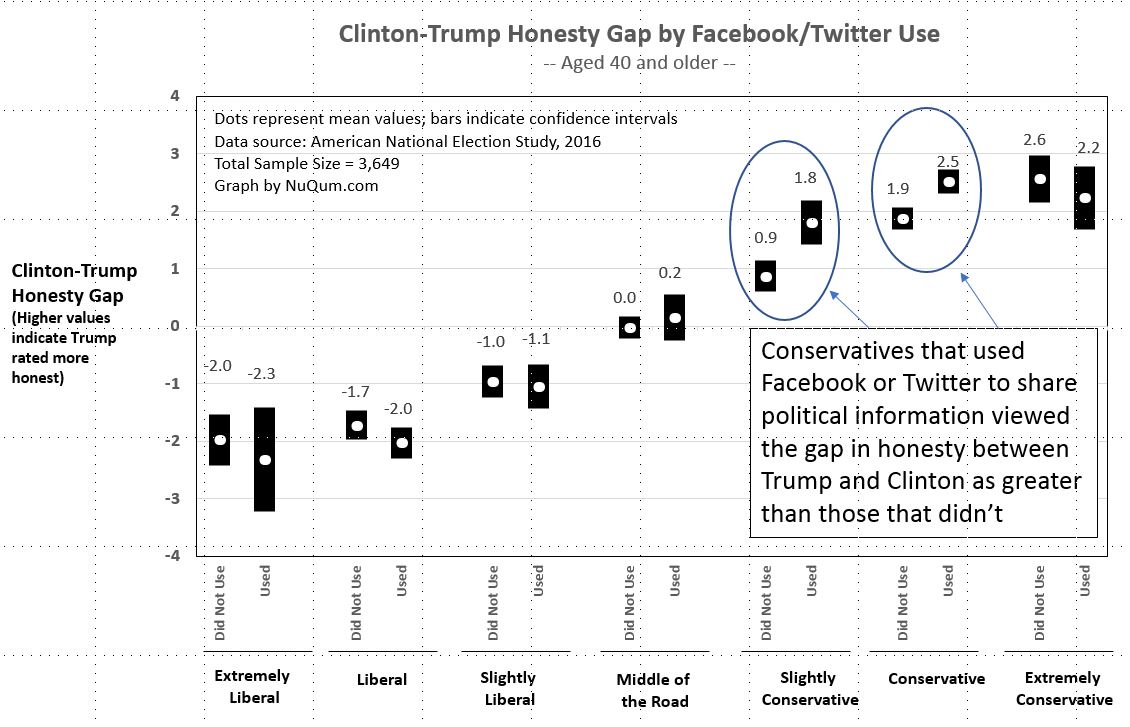
We believe these findings are tentative evidence of the Trump campaign’s intense targeting of conservative voters, particularly those most open to voting for Clinton, with negative campaign ads.
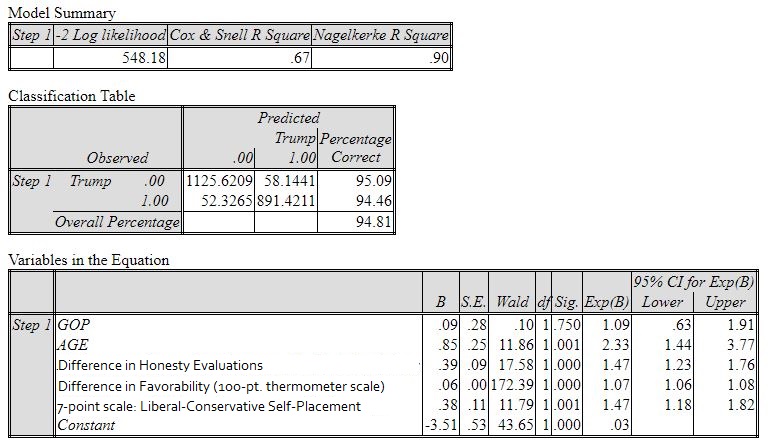
Within the 2016 ANES survey data, the relative favorability and honesty evaluations of the two candidates were highly significant predictors of actual vote decisions (see the SPSS output for a logistic model of 2016 vote choice in Appendix).
When we quantify our findings on the impact of Facebook/Twitter use for sharing political information, we get these results (see Table 1 below):

Based on the 2016 ANES survey data, we estimate over 28 million vote eligible Americans (or about 12 percent of the voter eligible population) were prime targets for the Trump campaign’s social media strategy. They were self-described as “conservative” or “slightly conservative” and used Facebook and/or Twitter for sharing political information. We consider this subgroup to be the primary source of any “social media effect” (SME) in the 2016 presidential election.
On election day, almost 16 million of these voters actually voted.
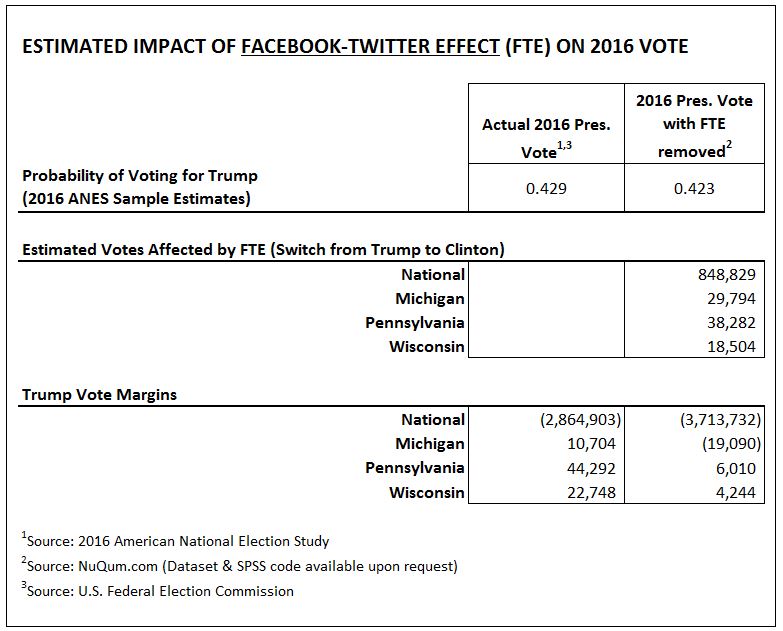
Using an admittedly ‘back-of-the-envelope’ method, we compare the actual vote totals with an alternative result had conservative Facebook-Twitter users held the same opinions as conservative voters that did not use Facebook-Twitter for sharing political information.
We estimate that, without the “social media effect” (SME), Trump would have lost the popular vote by 3.7 million votes and would have lost Michigan by 19,000 votes (see Table 2 above) He still would have won the electoral college in our estimate, but it would have been even closer than the actual 77,000 vote margin.
Keep in mind, we are not considering other subgroups (i.e., “middle of the road” and “slightly liberal” voters) that also may have been impacted by Trump’s social media efforts.
Nonetheless, the practical impact of an effective social media campaign can be the difference between winning and losing a presidential election. In our estimate, at a minimum a additional 1 million votes would have gone to Hillary Clinton had it not been for the Trump campaign’s (i.e, Cambridge Analytica’s) social media efforts.
More directly, we think Cambridge Analytica’s data insights were one of the decisive factors in Trump’s electoral victory, along with the mainstream media’s excessive gift of “free media” to the Trump campaign.
Did Cambridge Analytica pass its data to the Russians?
The big question becomes, did Cambridge Analytica pass its data (and algorithms?) on to the Russians? That is clearly where the mainstream media intends to take the Cambridge Analytica story.
The Twittersphere is flush with conspiratorial theories and some unverified evidence linking Cambridge Analytica to the Russians.
First reported by Slate.com, reports in late-October 2016 surfaced about a server in Trump Tower connected to a bank in Russia (the Alfa Bank).
Soon after the initial reports, bloggers @TeaPainUSA and @Conspirator0 analyzed server log data and suggested the Trump Tower server had been communicating during the 2016 general election period in a manner suggesting ‘database replication’ had occurred at distinct times by the Alfa Bank server. In addition, another server in the U.S., this one controlled by Spectrum Health, a company owned by the Devos family, which includes the current Secretary of Education, Betsy Devos, was also communicating with the Trump Tower server.
In addition, a September 2017 blog post by another blogger reported that a Silicon Valley Bank (SVB) server was also “sending Cambridge Analytica data targeting and propaganda messages to Trump’s server, in order that they be washed with the voter registration and DNC databases that were being sent to and from Alfa Bank” during the 2016 campaign.
As one might imagine, conspiracy theories have blossomed regrading the Trump Tower server, which is now part of the Mueller investigation. But, in all fairness, some early reports have thrown cold water on the suspicious Trump Tower and Alfa Bank server connections, suggesting they are the result of normal spamming activities that are common between commercial servers.
It is also possible that the Russian’s hacked into the Trump Tower servers without assistance from the Trump campaign. The Russians are good at that.
Nonetheless, particularly since the latest Cambridge Analytica controversy, the Trump Tower server story remains a small cottage industry for some investigative reporters and will hopefully be resolved when the Mueller investigation is completed.
Until that time, the 2016 voter opinion data we have analyzed convinces us that the Trump campaign’s social media efforts — whether aided by the Russians or not — were a significant factor in the 2016 presidential election. Call Cambridge Analytica’s methods sleezy and improper if you’d like, there is solid evidence they succeeded in helping get Donald Trump elected.
K.R.K
Appendix: Logistic Model of the 2016 Presidential Vote (American National Election Study)
{Send comments to: kkroeger@nuqum.com}
About the author: Kent Kroeger is a writer and statistical consultant with over 30 -years experience measuring and analyzing public opinion for public and private sector clients. He also spent ten years working for the U.S. Department of Defense’s Office of the Under Secretary of Defense for Personnel and Readiness and the Defense Intelligence Agency. He holds a B.S. degree in Journalism/Political Science from The University of Iowa, and an M.A. in Quantitative Methods from Columbia University (New York, NY). He lives in Ewing, New Jersey with his wife and son.
