Monthly Archives: May 2019

Despite the doomsday rhetoric, the conversion to renewables is moving along

By Kent R. Kroeger (Source: NuQum.com; May 29, 2019)

Recently, three major renewable energy milestones passed virtually unnoticed as the mainstream media continues to obsess about the 2020 presidential race, the aftermath of the Mueller Report, and the possible impeachment of President Donald Trump.

The first milestone was announced by the Institute for Energy Economics & Financial Analysis (IEEFA), when it reported that, in April and May,renewable energy sources, including hydroelectricity, will for the first time generate more U.S. electricity than coal-fired plants, signaling a “tipping point” in the advance of renewable energy as this nation’s primary source of electricity generation.

According to the U.S. Energy Information Administration (EIA), all renewables will produce 18 percent of U.S. electricity in 2019, and almost 20 percent in 2020. “Renewable generation is catching up to coal, and faster than forecast,” says Utility Dive editor Robert Walton.

The second milestone was announced by India’s Central Electricity Authority, when it reported India’s solar power industry generated 11.3 terawatt-hours (TWh) of solar power during the 1st quarter of 2019. This is a 16.5 percent increase from the previous quarter and a 57 percent increase from the same quarter in 2018. More significantly, it is the first time solar power in India has surpassed 10 TWh in a quarter, representing about 3 percent of all electricity generation. In total, renewable energy sources account for around 9 percent of all electricity generation in India.

Nine percent may seem small, but the long-term trajectory for renewables in India is on the rapid upswing. Without such progress by India (and China), any hope of achieving zero greenhouse gas (GHG) emissions on a global scale is lost.

The third milestone is less obvious but perhaps the most important. The International Energy Agency (IEA) recently announced that, despite fast Asian economic growth making coal more popular than ever as an electricity generation source, final investment decisions (FIDs) for coal plants have declined annually from 88 Gigawatts (GW) in 2015 to just 22 GW in 2018, the IEA announced in early May. Given that 30 GW of coal plants were retired last year and this retirement rate will continue into the foreseeable future, more coal capacity will be retired than approved each year going forward.

“This is a sneak preview of where we’ll be in three to four years time,” says Tim Buckley, director of energy finance studies at the Institute for Energy Economics and Financial Analysis, a renewable energy advocacy group. “If closures stay where they are, we’re at peak (coal) by 2021.”

The future is bleak for fossil fuels (especially coal)

Peak coal is finally visible on the horizon and the world is inexorably marching towards net zero GHG emissions with certainty in the latter half of this century. While still facing many technological challenges —advances in battery storage being among the biggest— the world’s path to zero-emissions electricity generation by 2050 is not wishful thinking (see Figure 1). And the green transformation of other major GHG sources — transportation and industry— won’t be far behind. Electric vehicles, in fact, may be cheaper than internal combustion engine vehicles by 2022, significantly accelerating the transition.

Figure 1: International Renewable Energy Agency (IRENA) Forecasts for Renewable Energy through 2050

Source: Global Energy Transformation (IRENA, 2019)


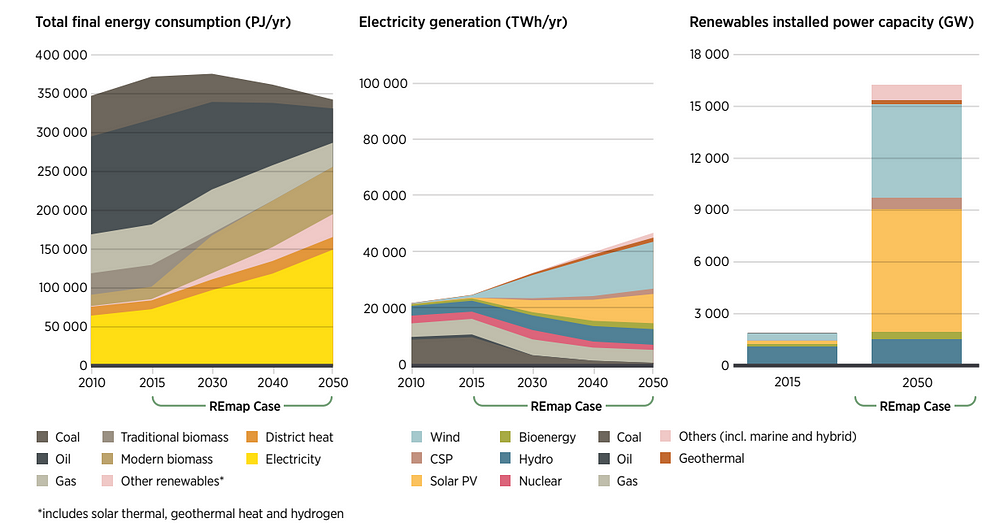
Of course, forecasts can be wrong as they are dependent on a myriad of factors, not all under our control. And the potential for policy changes and economic shocks to stunt our progress can never be ruled out.

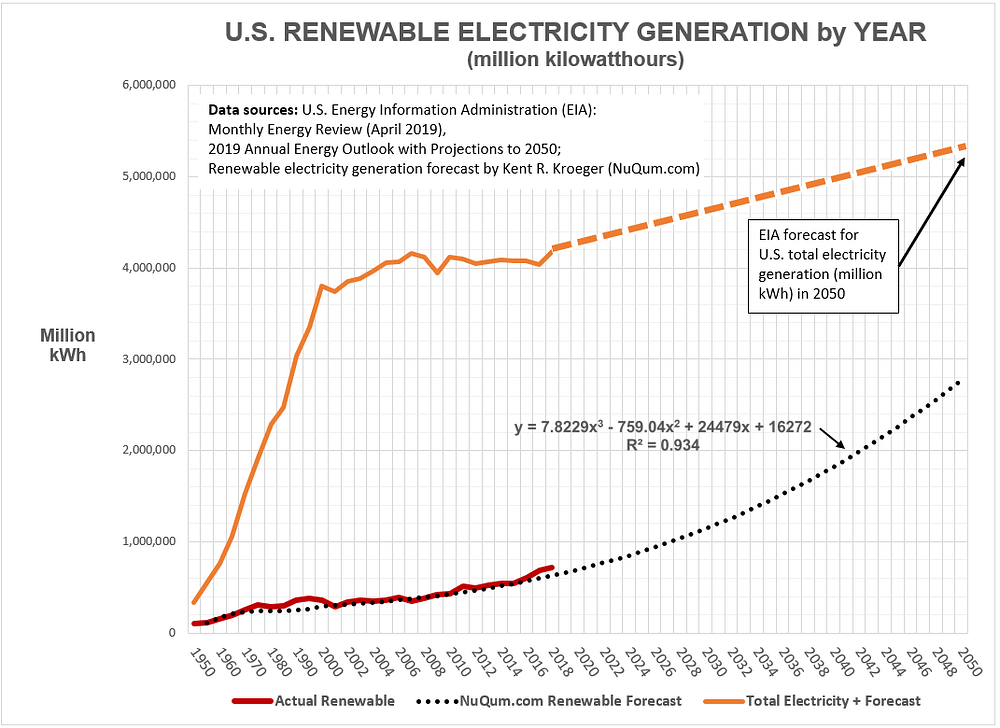
Still, even with the Trump administration’s open hostility to climate change science, the U.S. continues its conversion to renewable energy which accelerated during the Obama administration and, according to recent figures from the EIA, has continued in the Trump administration’s first two years (see Figure 2). Indeed, as a source for electricity generation, renewable energy has grown faster annually in Trump’s first two years than during Obama’s eight years (8.2% avg. annual growth vs. 6.3% avg. annual growth, respectively). In comparison, renewable energy’s annual growth during George W. Bush’s tenure was only 1.4 percent.

Figure 2: U.S. Renewable Electricity Generation (Actual and Forecast)

Why the gloom and doom among climate change activists?

If these recent headlines are any indication, the dominate political-media narrative is oblivious to the real progress being made on renewable energy:

Climate change WARNING: Oceans could rise 7 FEET putting 200 MILLION at risk (The Daily and Sunday Express, May 24, 2019)

It is absolutely time to panic about climate change: Author David Wallace-Wells on the dystopian hellscape that awaits us (Vox.com, February 24, 2019)

The grave threat to US civilisation is not China, but climate change (South China Morning Post, May 28, 2019)

“It is, I promise, worse than you think,” environmental author David Wallace-Wells warned in 2017 about climate change’s impact.

How could a dystopian hellscape be anything else but worse than expected?

“Last year in the summer of 2018 in the Northern Hemisphere you had this unprecedented heat wave that killed people all around the world. You had the crazy hurricane season. In California, wildfires burned more than a million acres. And we’re really only just beginning to see these sorts of effects,” Wallace-Wells recently told Vox.com. “If we continue on the track we’re on now, in terms of emissions, and we just take the wildfire example, conventional wisdom says that by the end of the century we could be seeing roughly 64 times as much land burned every year as we saw in 2018, a year that felt completely unprecedented and inflicted unimaginable damage in California.”

Apocalyptic jeremiads like Wallace-Wells’ new book, “The Uninhabitable Earth,” demoralize readers and feed a sense of hopelessness at the precise moment we need to motivate them. Up to now, such climate change alarmism has been an ineffective strategy to build broad public support for policies that will fundamentally reorganize the world economy.

In spite of that, alarmism remains front-and-center in the 2020 U.S. presidential race. In a thinly-veiled response to former Vice President Joe Biden’s recent suggestion of a “middle ground” approach to climate change, New York Representative Alexandria Ocasio-Cortez said: “I will be damned if the same politicians who refused to act (in past decades) are going to try to come back today and say we need a middle of the road approach to save our lives.”

At least on paper, Ocasio-Cortez has backed up her climate change rhetoric with a wide-ranging manifesto, the Green New Deal (GND). On a scale far grander than Obamacare, the last significant government program passed by Congress, the GND envisions the elimination of greenhouse gas emissions in the U.S. by 2030 with renewable and zero-emission energy sources, including nuclear power, making up 100 percent of U.S. power demand. Ambitious on paper, the GND is the ultimate stretch-goal. That is what saving the planet and the people on it will require, says Ocasio-Cortez.

Backbreaking to the U.S. economy is how Republicans describe the GND. “It is quite amazing that someone that is in government — actually elected to the government of the United States of America — would propose that we eliminate all fossil fuels in 12 years,” said Greenpeace Co-Founder Patrick Moore in an interview with The New American. “If we did it on a global level, it would result in the decimation of the human population from 7-odd billion down to who knows how few people.”

With the GND, the progressive movement’s over-stimulated ego meets the Republican’s science agnostic id. Its a septic brew not conducive to successful policymaking.

Yet, we make progress anyway.

To ignore the real advances made in expanding renewable energy capacity in the U.S. (and around the world) is to mischaracterize reality. Furthermore, the momentum in the U.S. has occurred against a hyperpartisan political backdrop where very little substantive climate change legislation has been passed in the past two decades. To the contrary, according to the International Monetary Fund, U.S. direct and indirect subsidies for coal, oil and gas reached $649 billion in 2015. That is more than we spend on national defense.

In an odd way, that should be reason for optimism moving forward. Imagine what this country could do on renewable energy if it stopped distorting the marketplace in favor of fossil fuels and let the free market decide.

That is a project even Republicans might get behind.

  • K.R.K.

Why won’t Russiagate go away?

By Kent R. Kroeger (Source: NuQum.com; May 24, 2019)

last wrote the about Trump-Russia collusion investigation in August 2018, promising to myself I wouldn’t return to the story unless genuinely new information emerged.

Since then, with respect to a conspiracy with Russia, the sectarian news media has proffered no new, inculpating evidence against President Donald Trump and his 2016 campaign.

None. Zippo. Nada.

Instead, they recycled old news (e.g., Powerpoint summaries of Trump campaign survey data given to Russian-allied operatives) or blatantly false news (e.g., secret Manafort-Assange meetings in an Ecuadorian embassy) to keep the story alive.

Despite the demonstrably poor journalism, Figure 1 shows how the American public’s interest in Russiagate — as measured by their Google search frequencies on related key terms — has not waned since the start of the story in 2016. If anything, it has increased.

Figure 1: Google Search Trends Related to Russiagate

Source: Google Trends


And why? The obvious source of the continued Russiagate interest is the news media itself, which in the past two years has taken only brief respites from Russiagate to cover stories such as Syria, Venezuela, school shootings, immigration and the Democratic Party’s presidential nomination race.

Jointly, the news media and its consumers are engaged in a strategy investors call ‘averaging down.’ This is an investment approach where, as the value of an asset declines from its original purchase price, the investor buys additional units of that asset in the expectation that it will eventually recover some or all its original value. It is the investor equivalent of continuously moving the bar lower.

Is it a good strategy? Yes, if the asset’s value recovers. Should it not recover, the investor is royally screwed.

In that context, Russiagate, as a common stock, would be valued in pennies right now, having plunged precipitously after the April release of the redacted Mueller report which confirmed what objective observers already suspected: the Trump campaign was amateurish, disorganized, prone to poor judgment, and unethical at times, but it did not conspire with the Russians in the 2016 election to defraud the American people.

Trump’s campaign was unquestionably probed and approached by Russian intelligence operatives (and by Western intelligence operatives as well — as we will find out in the near future), but there was no conspiracy.

The Mueller report is unequivocal on this point:


Suggestions that the Mueller investigation found evidence of a conspiracy — but not enough to indict — is merely the news media employing the ‘averaging down’ strategy and choosing to stay in its advocacy journalism comfort zone, even if it risks losing whatever credibility they still possess.

Left at the conspiracy theory alter by Mueller, the Democrats and the news media are now feverishly trying to convert their shares of the Trump-Russia conspiracy into shares of Trump obstructed justice and must be impeached.

Cable news has become a 24–7 symposium on the legal definitions of obstruction of justice and constitutional theories on impeachment. And if the last two years is an indication, they probably are misleading us on that story too.

Independent journalist Michael Tracey aptly explains the psychology of why the Democrats and the national news media can’t move on from Russiagate and its conspiratorial subsidiaries: “Since 2016, liberals/leftists have perpetuated a moral panic to validate their own parochial political and personal obsessions. They’ve done a lot of damage in the process, not least to people’s psyches. Don’t count on the fever dream ending any time soon.”

Russiagate’s damage is real. This country is not having a constructive dialogue on Libya (where the U.S. seems to be embracing the general — a Virginia resident — trying to take over the country), Yemen (an ongoing humanitarian disaster where there is a lot of blame to pass around), regime change wars(pick any country with oil that the U.S. doesn’t control — Norway, we’re watching you), Medicare-4-All (it is less costly than our current health care system, but if you’ve been watching Jake Tapper, Chris Matthews or Fox News, you wouldn’t know that), climate change (yeah, I would avoid buying coastal or riverbank property going forward), consumer debt (Why does Joe Biden support the Delaware-incorporated bank lenders over student borrowers and credit card consumers? I may have just answered my own question), growing income inequality (that is what a $700 billion defense budget buys), and the list goes on.

Instead, such concerns are mocked for taking our attention away from the media-embellished crisis called Donald Trump (see cartoon below).

Cartoon by Nate Beeler (Columbus Post-Dispatch); Courtesy of Cagle Cartoons.


Who is stopping these conversations? It is not Donald Trump or Fox News. You are far more likely to get a balanced discussion on Venezuela from Tucker Carlson than you are from Rachel Maddow or Chris Cuomo.

Who is stopping debates on the most important topics of the day? It is the Democratic Party establishment. They are terrified of genuine policy discussions on health care, Venezuela or Iran. Feel free to talk about Peter Buttigieg’s articulateness or Kamala Harris’s favorite music. But ask questions about Venezuela or the dysfunction of our current health care system? Kein Kommentar, says the Democratic Party.

Still, there is hope. The American people are starting to disengage from the mainstream media.

MSNBC and CNN’s ratings are plunging — post-Mueller report.

If we are lucky, this may augur an era of new thinking by the news media. Perhaps they will finally realize it is time to move on from 2016.

  • K.R.K.

Can the Democrats keep their left flank intact?

By Kent R. Kroeger (Source: NuQum.com; May 20, 2019)

Defense of the left flank has been pivotal in U.S. history.

Perhaps no example more important than during the Battle at Gettysburg when General Lee’s Confederate Army attacked the Army of the Potomac’s lightly-defended left flank, commanded by Major General George Meade, at Little Round Top on July 2, 1863.

Had the Confederates captured Little Round Top, Confederate cannon fire likely would have broken the Union lines and led to their defeat at Gettysburg, allowing Lee’s Confederate forces to march on towards Washington, D.C. and possible victory in the Civil War.

Had that happened, our country would probably be very different today.

As it is, some otherwise reasonable people are arguing, including Donald Trump’s former lawyer, Michael Cohen, that President Trump would start a Second Civil War, if he had to, just to stay in office.

“In years past, Americans have trusted our system of government enough that we abide by its outcomes even though we may disagree with them. Only once in our history — in 1861 — did enough of us distrust the system so much we succumbed to civil war,” writes former Secretary of Labor under Bill Clinton, Robert Reich. “But what happens if an incumbent president (Trump) claims our system is no longer trustworthy?”

Such speculation is careless hyperbole, but does demonstrate how critical many Democrats view the upcoming 2020 presidential election and why they might want to pay more attention to their left-flank problem.

How big could a left-flank collapse become within the Democratic Party?

The Democratic Party’s left flank is not as big as progressives want to believe, either is it as small as establishment Democrats want to admit. Using the 2018 American National Election Study’s (ANES) survey of 2,500 vote eligible Americans, in previous essays to I tried ascertain the size of the Democrats’ most progressive wing. Whether using self-described ideology measures or a summary of public policy attitudes, my conclusion has generally been that approximately 25 percent of the Democratic Party is a left-flank progressive.

Its not large enough to take control the Democratic Party, but large enough to tilt the balance in a close presidential election — which is the focus of this essay: If the Democrats nominate former Vice President Joe Biden, how many left-flank progressives could potentially defect from their party’s 2020 presidential nominee?

The answer might not satisfy either ideological side of the Democratic Party.

Data and Methods

To assess the potential scale of a left-flank collapse within the Democratic Party, I looked at the self-reported votes and vote intentions of all 2,500 ANES respondents (an effective sample size of 1,451 respondents when survey design effects are considered).

As a first step, I divided the respondents into two groups: (1) Those intending to vote in the 2020 Democratic primaries (48% of the voting eligible population [VEP]), and (2) those respondents that are not (52% of VEP). Not surprisingly, most in the first group are self-reported Democrats (80%) and the remaining are evenly split between Republicans and independents. Likewise, 61 percent in the second group are Republicans, followed by independents (26%) and Democrats (13%).

Respondents intending to vote in the 2020 Democratic primaries were asked their vote preference at the time of the ANES survey (December 2018), along with their 2016 vote choice and their preference between Trump and former Vice President Joe Biden in 2020.

Figure 1 shows the cell percentages within likely 2020 Democratic primary voters crossed by their 2016 vote choice (Clinton, Trump, Someone Else, or Not Voting) and their likely choice in 2020 (Biden, Trump, or Third Party/Not Voting). Respondents indicating they would vote for either Bernie Sanders or Elizabeth Warren in the primary were labeled ‘progressive’ Democratic primary voters, and those indicating they would vote for Biden, Kamala Harris, Beto O’Rourke, Cory Booker, Kirsten Gillibrand, or Amy Klobuchar, were labeled ‘establishment’ voters.

Figure 1: Vote Choice in 2016 and Vote Intentions (as % of Likely 2020 Democratic Primary Voters).


From this crosstabulation, respondents were classified into one of four ‘Democrat Party defector’ categories: (1) Most Likely Defectors, (2) Likely Defectors, (3) Possible Defectors, and (4) Unlikely Defectors.

Democratic Party Defector Definitions:

Most Likely Defectors: Intends to vote for someone other than Biden in the 2020 Democratic primary, and intends to vote for Trump, a third party, or not vote in the 2020 general election (if Biden is nominated).
Likely Defectors: Will vote for Biden in the primary, but intends to vote for Trump, a third party, or not vote in the 2020 general election (if Biden is nominated).
Possible Defectors: Will vote in the 2020 Democratic primary, intend to vote for Biden in the general election, but either did not vote in 2016, voted for Trump, or voted for someone else.
Unlikely Defectors: Will vote in the 2020 Democratic primary, intend to vote for Biden in the 2020 general election, and voted for Hillary Clinton in 2016.

The Results

Of primary interest in this essay are the Most Likely Defectors — who are the group most likely to either vote for a third party candidate or not vote at all. They account for 20 percent of likely Democratic primary voters and are evenly split between ‘progressive’ Democratic voters and ‘establishment’ (but not Biden) voters. Likely Defectors are a mere 4 percent, while Possible Defectors make up 19 percent of likely Democratic primary voters. By far, Unlikely Defectors are the largest category, representing 57 percent of likely Democratic primary voters.

More instructive is to look at those proportions relative to the VEP. In Figure 2, we see that Most Likely Defectors make up 9 percent of the VEP, of which 4.2 percent are progressives — representing a voter group larger than the popular vote gap between the two major-party candidates in four of the past six presidential elections. And that does not factor in the Possible Defectorsthat could add as much as 2.2 percent of the VEP to that voter group.

Given that Hillary Clinton won the 2016 popular vote with only 27 percent of the VEP (compared to 26 percent for Trump), the possibility of Biden losing even half of the Most Likely Defectors in the Democratic Party’s left flank is potentially decisive.

Figure 2: Vote Choice in 2016 and Vote Intentions (as % of Vote Eligible Population).


The Democratic Party’s vulnerability to a collapse of its left flank is far from certain should Biden become the party’s nominee. It is equally probable that the establishment-preferring right flank — equal in size to the left flank — will defect. The 2020 outcome very likely could come down to how well Biden (or any Democratic nominee) balances the policy demands of the left flank (e.g., Medicare-for-All, the Green New Deal, etc.) and the centrist policy preferences of the party’s right flank. Going too far in either direction could be the biggest mistake the party nominee makes.

It’s a balancing act Joe Biden has never accomplished as a presidential candidate.

Barack Obama was able to paper over many of those fundamental party differences with his charisma and barrier-breaking candidacy. It is hard to see how Biden can recapture that level of political energy.

However, thanks to Trump’s comparatively low approval ratings and apparent inability (or desire) to expand his support base, Biden may not need Obama’s magnetism. He only needs the support of more than 26 percent of the vote eligible population which appears to be the maximum Trump can expect.

To be clear, the Republicans have a much bigger electoral coalition problem at the presidential level than do the Democrats — which I examined in a previous essay.

Nonetheless, Biden potentially losing support from four percent of the vote eligible population due to a left-flank rebellion is unacceptable and, based on the 2018 ANES, not at all impossible.

  • K.R.K.

Data and SPSS code available upon request to: kroeger98@yahoo.com


Appendix: Notes on Expected 2020 Presidential Voter Turnout

Vote choice represents roughly half of the prediction equation. Also important is the decision whether to vote at all, or to vote for a third party (which is equivalent to not voting from the perspective of the two major-party candidates).

Therefore, for methodological simplification, I’ve combined non-voting with third-party voting in this essay.

The 2016 presidential election had a 55.7 percent voter turnout, with 94.3 percent of the vote going to either Hillary Clinton or Donald Trump, the remaining vote going to other candidates. Adjusted to represent only Clinton or Trump voters (the two-party vote), the 2016 presidential election had a voter turnout of 52.5 percent. The average two-party presidential vote turnout since 1996 has been 51.9 percent.

Based respondents’ self-reported intentions in the 2018 ANES, the two-party voter turnout in 2020 will be around 62 percent of the VEP (see Figure A1). That would exceed by a significant margin the 57 percent two-party voter turnout in the 2008 election. While self-reported behaviors in opinion surveys are often inflated, the 2018 ANES results may be foreshadowing an unusually large voter turnout in 2020.

Figure A1: Expected Two-Party Vote in 2020 based on 2018 ANES

Is Iran the biggest state sponsor of terrorism?

By Kent R. Kroeger (NuQum.com; May 16, 2019)

In announcing the U.S. designation of the Iranian Islamic Revolutionary Guard Corps (IRGC), a branch of Iran’s armed forces, as a “terrorist organization,” U.S. Secretary of State Mike Pompeo told the State Department press corps, “This historic step will deprive the world’s leading state sponsor of terror the financial means to spread misery and death around the world.”

Coupled with the Trump administration’s ratcheting up of sanctions against Iran in early May and the recent sabotage attacks on Saudi-flagged oil tankers, the possibility of a shooting war between the U.S. and Iran has not been higher perhaps since the start of the Islamic Republic in 1979.

According to The New York Times, the Pentagon is updating its Iran war plans, similar to pre-planning associated with the 2003 Iraq War. While President Donald Trump denies such a process is ongoing, it would be consistent with standard Pentagon operating procedures anytime the heightened possibility of a U.S. military engagement exists.

But with any commitment of U.S. military personnel to combat, the administration’s justification to the U.S. public requires a consensus view that the enemy — in this case, Iran — is an unequivocal and imminent threat to U.S. national security.

That is why calling Iran the leading state sponsor of terrorism — and people believing it — is so critical. Should that accusation lack credibility, the entire War-on-Iran project is at risk.

This is why we hear the ‘Iran is the leading sponsor of terrorism’ refrain is repeated over and over again by hawkish neoconservatives, typically without any substantive push back from the news media or other politicians. Eventually, people will just assume it is true, even if Iran’s leaders insist it is not.

When asked once about Iranian denials about a nuclear weapons program, South Carolina Senator Lindsay Graham replied: “Everything I know about the Iranians I learned in the poolroom. I ran the poolroom when I was a kid and I met a lot of liars and I know the Iranians are lying.”

Graham’s Senate colleague and good friend, the late John McCain, famously insinuated he would go to war with Iran if he were elected president when he sang “bomb bomb Iran” to the melody of the Beach Boys’ old hit song “Barbara Ann.”

“Why do we keep listening to these people?” asks author Robert Morris, who as written frequently on Iran, Saudi Arabia and other Middle East topics. “Their fantasies are hurting Iran, hurting the rest of the world, and they are hurting the United States.”

Data and Methods

The easy answer to Morris’ question is that few U.S. journalists and political elites challenge the ‘Iran is the leading state sponsor of terrorism’ narrative. If they did, they might start by digging into the University of Maryland’s Global Terrorism Database (GTD), an open-source database on terrorist events around the world from 1970 through 2017.

Though the GTD does not identify state sponsors of individual terrorist acts, it does indicate — when known — the group(s) that perpetrated the act. Terrorist incidents where the perpetrators were unknown were excluded in the following analysis. From this information, I was able to segregate individual terrorist acts by the ideological alignment of the terrorist groups involved and used this as a proxy measure of state-sponsored terrorist activities.

Methodological Note: As is often the case in social science research, control the definitions and you control the conclusions. The statistical results presented in this essay use the GTD’s ‘terrorism’ definitions which match the definitions used by the U.S. government and many other Western defense and security agencies. Groups labelled in this essay as terrorist organizations (e.g., Hamas, Hezbollah, etc.) may not fit others’ definitions , including my own. But for this analytic exercise, using the U.S. government’s definitions actually serve to reinforce this study’s conclusions that common assumptions about the perpetrators of worldwide terrorism are distorted.

For worldwide terrorist acts since 1994, where the GTD identified the perpetrators (about 48 percent of all terrorist acts), I categorized the ideological orientation of the terror groups into one of four categories: (1) major Shia-aligned groups, (2) major Sunni-aligned groups, (3) AF/PK Taliban-aligned, and (4) ‘Other’ for all incidents linked to smaller Sunni-aligned jihadist groups (<50 attacks) or non-jihadist groups.

There are some notable exceptions. Hamas, for example, is largely a Sunni-aligned group reflecting the majority of Palestinians living in Gaza, but is assumed in the West to be one of Iran’s proxies in the region. In reality, according to former Israeli national security adviser Yaakov Amidror, it is the Islamic Jihad, not Hamas, that is a completely “owned and operated Iranian subsidiary.”

“(Islamic Jihad) was established by Iran, financed by Iran, and does what Iran wants it to do,” says Amidror. Nonetheless, I categorize both Hamas and Islamic Jihad as Shia(Iran)-aligned for the purposes of this essay.

The other major exception to the ‘Shia versus Sunni’ categorization rule is the Sunni-aligned Taliban — in Afghanistan and Pakistan — that was originally financed by Saudi Arabia and trained by Pakistan’s intelligence agency, Inter-Intelligence Service (ISI), during the Soviet occupation in the 1980s. However, to consider the Taliban part of a Sunni-aligned terror network is not entirely accurate as, historically, its financial, training and materiel support has come from both Saudi Arabia and Iran.

In fact, the Taliban is one of the few combatant groups in the Middle East where Iran (Shia) and Saudi Arabia (Sunni) find some common ground. For Iran, keeping the Taliban competitive in Afghanistan serves to further drain U.S. resources and energy in the region. Whereas, for Saudi Arabia, a strong Taliban serves as an anti-Shia proxy group to counter Iranian influence in Afghanistan. Therefore, I categorize the Taliban separately from the Shia- or Sunni-aligned camps.

The Results

Since 1994, three percent of terror incidents have been associated with major Shia-aligned terror groups (see terror group list in Appendix), compared to 27 percent for major Sunni-aligned terror groups (see Figure 1). The Taliban as been linked to only 15 percent of worldwide terror incidents. The vast majority of the remaining terror incidents are linked to minor Sunni-aligned jihadist groups.

Overall, the number of terrorist incidents experienced a significant increase after 2011 (the start of the Syrian Civil War) and has been dropping since 2015 when the U.S., Russia, Syria (Assad), Iraq and Iran better coordinated their efforts to rollback ISIS in Syria and Iraq.

However, Shia-aligned groups, principally the Houthi rebels, increased their activity after 2014 with the start of the Yemen Civil War. Even so, major Shia-aligned groups accounted for only 3 percent of incidents in 2017, compared to 38 percent for major Sunni-aligned groups.

Figure 1: Terrorist Attacks since 1994 by Terror Group Ideology

Analysis of GTD by Kent R. Kroeger (NuQum.com)


Figure 2 paints a similar picture with respect to the number of people killed in terror attacks between 1994 and 2017. Deaths linked to major Shia-aligned groups accounted for 2 percent of the 218,104 killed in terror attacks during this period. In contrast, major Sunni-aligned groups accounted for 43 percent and the Taliban 16 percent of terror deaths.

The lethality of Sunni terror attacks was also significantly higher than for either Shia- or Taliban-related attacks. Sunni attacks averaged 5.7 deaths per attack, compared to 4.0 for the Taliban and 2.4 for Shia groups. Between 2014 and 2017, the Sunni-aligned Islamic State in the Levant (ISIL) averaged 7.2 deaths per attack and alone accounted for 31 percent of all terrors deaths in that period.

Figure 2: Number Killed by Terrorist Attacks since 1994 by Terror Group Ideology

Analysis of GTD by Kent R. Kroeger (NuQum.com)


In Figure 3, we see there have been four periods of heightened activity among Shia-aligned terror attacks between 1994 and 2017: (a) the end of the First Palestinian Intifada (1994), (b) the peak of the Second Palestinian Intifada (2001 to 2003), (c) the 2006 Israeli-Hezbollah War and (d) the still ongoing Yemen Civil War from 2014 to 2017.

Among those spikes in terror activity, the Yemen Civil War has witnessed by far the biggest increases in Shia-related activity, sourced almost exclusively from the Houthi rebels (Ansar Allah). Between 2014 and 2017, the Houthis were responsible for 1,027 terror attacks (87% of all Shia-aligned attacks) compared to 8 percent for Hamas and less than 2 percent for Hezbollah.

Figure 3: Terrorist Attacks since 1994 by Shia-aligned Groups

Analysis of GTD by Kent R. Kroeger (NuQum.com)


But the Shia numbers pale in size relative to Sunni-related terror activity in that same period (see Figure 4). Between 2014 and 2017, ISIL alone was responsible for 5,329 attacks and Boko Haram and al Shabaab, combined, added another 4,010 attacks to the Sunni-aligned total.

Figure 4: Terrorist Attacks since 1994 by Sunni-aligned Groups

Analysis of GTD by Kent R. Kroeger (NuQum.com)


Shia-aligned terror groups are just not in the same league as the major Sunni-aligned groups — which U.S. and Western intelligence services acknowledge receive significant financial and materiel support from state and non-state actors in Saudi Arabia, the United Arab Emirates (UAE) and other Sunni-majority countries.

This gap in Sunni versus Shia terror activity should not surprise anyone. The combined size of the Saudi and UAE economies are over 2.5 times larger than Iran’s, who additionally finds itself facing strict U.S. sanctions on its oil exports — the largest segment of Iran’s economy — which will only further degrade Iran’s ability to project power in the region.

In this context, the distorted U.S. propagandized image of Iran’s aggression looming over the Middle East is, frankly, ‘fake news.’ It is not happening now. And it hasn’t happened in the past — certainly not the recent past.

Using an index I’ve created called the Iran Aggression Index — which is merely the variation in Shia-aligned terrorist activity not explained by variation in Sunni-aligned terrorist activity — Figure 5 shows when Shia-aligned terrorist activity has been most aggressive. Similar to the findings in Figure 3 (above), there are four distinct periods where Shia-aligned terror activity has been higher than expected. And, again, it is the period at the start of the Yemen Civil War and leading up to the U.S. and its allies signing the Joint Comprehensive Plan of Action (JCPOA) with Iran in 2015 that Shia-related terrorist activities spiked. Whether this was done by Iran for leverage in the JCPOA negotiations is debatable, but the coincidence is nonetheless noted.

More interesting, however, is the significant decline in the Iran Aggression Index in the years immediately after Barack Obama was elected president and when the U.S. was pushing for hard for an agreement to end (or, more accurately, delay) Iran’s nuclear ambitions.

Ironically, since Trump’s election, Shia-related terrorist activities have again started to drop below baseline levels (at least in 2017).

Figure 5: Iran Aggression Index (1994 to 2017)

Data source: The Univ. of Maryland’s Global Terrorism Database (GTD); Analysis of GTD by Kent R. Kroeger (NuQum.com)

Final Thoughts

Iran is not by any stretch of the imagination the largest state-sponsor of terrorism, regardless of how one wants to define and divide up terrorist activities over the past 25 years.

Between Iran’s known sponsorship of terrorist acts — and, make no mistake, Iran has sponsored heinous terrorist acts, most notably the 1983 Beirut barracks bombings killing 305 U.S. and French military personnel — and Saudi Arabia’s known complicity in financing ISIS and other Sunni-aligned terrorist activities, there is plenty of complicity in worldwide terrorism to spread around at the state-level.

Israel is now known to have helped finance and arm ISIS in its fight against the Assad regime. “The enemy of my enemy is my friend,” says the ancient proverb. Statecraft is a ruthless business.

The U.S. itself armed known elements of jihadist terror groups — such as the Al-Nusrah Front — during the Syrian Civil War. From 2012, after the U.S. had started arming ‘moderate’ factions of the Al-Nusrah Front, this group committed 277 known terrorist attacks, killing 2,978 people, many of them civilians.

But since it was in the service of fighting Syria’s Bashar al Assad, a man that gassed his own people, doesn’t that make it OK? For the hundreds of thousands of Syrian civilians killed by the Iran-backed Assad regime, ISIS and other various rebel groups roaming Syria during the civil war, assigning original blame is not much help. But I hope we can agree that arming known terrorist groups in an attempt to overthrow a vicious dictator is formula for deadly, unintended consequences.

Iran will never be the dominant hegemon in the Middle East. There are simply not enough Shia Muslims upon which to build such dominance. An Iran with nuclear weapons, on the other hand, would be a major threat to states like Israel and Saudi Arabia and it is not all surprising (and is entirely defensible) that such countries would do everything in their power to stop that from becoming a reality.

Iran must not have nuclear weapons (neither should Israel, India or Pakistan, for that matter).

But Iran is not the leading state-sponsor of terrorism in the world and predicating another U.S.-led land war in the Middle East on such a fiction will only fuel worldwide opposition to such a war. And wars built on lies don’t generally end well for the U.S.

  • K.R.K.


APPENDIX: List of Major Terror Groups

Major Shia-aligned Terror Groups:


Major Sunni-aligned Terror Groups:

I am a centrist Democrat and I will never vote for Joe Biden

By Kent R. Kroeger (Source: NuQum.com; May 10, 2019)

There is nothing in former Vice President Joe Biden’s voting record that compels me to ever vote for him: The Iraq War. The Patriot Act. TPP. Regulating banks. Health care reform.

Joe Biden is a walking billboard for why Donald Trump is president today.

And if the general election choice in 2020 is between Joe Biden and President Trump, I will not vote at the presidential level, assuming no attractive third party candidate emerges.

My Democrat wife and our liberal acquaintances are appalled at this declaration.

I don’t care. I’ve survived almost three years of Donald Trump, I can survive five more years, if I must.

My Democratic friends, in the meantime, have become Rachel Maddow-obsessed, Russia conspiracy theorists and have willingly jettisoned their intellectual credibility in the process. They ignore proven facts (the Mueller Report is unequivocal in its exoneration of the Trump campaign with respect to conspiring with the Russians) and instead filter all new information through biased filters that serve only to validate their lizard-brain, partisan predispositions.

Since they fundamentally failed to comprehend the Trump-Russia collusion hoax, its hard to take them seriously on much else.

I am embarrassed by what as become of the Democratic Party since Donald Trump’s election in 2016.

As such, I have given up hope that there is a political party or candidate that will appeal to all of the issues I care most about: health care reform, regulating banks, Palestinian rights, student debt relief, and ending U.S.-led regime change wars)

Lacking this comprehensive political option, I have become — reluctantly — a one issue voter: Tell me how you will reform our broken health care system.

If a candidate offers no concrete proposals on this issue, don’t bother me with their campaign rhetoric:

Legalizing marijuana? Don’t smoke it, and don’t care.

The Iran threat? Hezbollah and the Houthi fighters have no issue with me.

Build a wall on our southern border? Frankly, I probably like the people coming over the border illegally more than I like you.

In contrast, our broken health care system is something we all can recognize.

The American health care system is an embarrassment within the league of advanced economies. Chile and Lebanon have superior health care outcomescompared to the U.S., and they spend a fraction of their national economic output on health care.

That is why the list of presidential candidates I will NEVER consider in 2016 grows longer with every new entrant:

Amy Klobuchar, Pete Buttigieg, Cory Booker, Donald Trump, Kamala Harris, Joe Biden, Jay Inslee, and John Hickenlooper.

Why do they lack meaningful proposals on health care? Because they don’t care enough to make the effort. They are comfortable with the current system and many of them have their campaign’s funded by the special interests dedicated to preserving that system.

And they have zero chance of getting my vote. Zero. As in, there is not even a remote possibility I will pull the lever next to their name, even if Trump is the opposing party’s option.

Trump and Russiagate are irrelevant in my worldview, even as I recognize that Russia meddled in the 2016 election. Besides, it was never my responsibility to protect the American democracy from the Russians. That was Barack Obama’s job and he fumbled the ball in the worse possible way.

Stop protecting Obama. He failed at his number one responsibility: protecting the U.S. from foreign aggressors. Plus, his health care reform idea was conceptually impotent and based on a Republican idea from the 1990s. And what has been the result? Health care costs are still rising and Americans continue to be under-served by a hopelessly inefficient health care delivery system.

Subsequently, Obama is irrelevant and I beg Democrats to move on.

Due to a deeply-flawed Democratic presidential candidate in 2016, this country has Donald Trump for a president — a man who has offered no new health care ideas in Obamacare’s place and is therefore unsupportable in my view.

But what is the alternative?

Bernie Sanders is at the top of the list, for apparent reasons, but there are few others: Elizabeth Warren and Tulsi Gabbard are the only other names that come to mind.

No candidate is perfect, and I’ve long given hope that one exists at the presidential candidate level.

Still, I choose candidates based on a simple set of criteria: (1) Speak the truth as you understand it, (2) treat your opponents as family, (3) don’t pose as something you are not, (4) and don’t judge others lest you are willing to be judged by those same standards.

On those metrics, few politicians score high.

Our political system is broken. Few dispute that fact. But, Democrats, don’t compound the errors of the past by nominating Joe Biden to represent the best interests of the average American. He has never been that candidate and nothing has changed since 2016 to think he has become that candidate.

Joe Biden and Donald Trump are unacceptable to me.

I only hope better alternatives emerge by November 2020.

  • K.R.K.

There will be fewer tropical cyclones, but they will be stronger (and probably bigger)

By Kent R. Kroeger (Source: NuQum.com; May 8, 2019)

My previous essay investigated whether tropical cyclones since 1960 have grown more intense. Admittedly, my finding that the minimum central pressure of the average tropical cyclone was dropping by .09 millibars (mb) every year was exploratory. I am a statistician, not a climatologist — which means I’m comfortable enough with climate data to do real damage.

Intellectual limitations aside, my earlier conclusion is consistent with other climatological studies whose models predict a higher frequency of high-intensity storms in the South Indian Ocean, the Northern Atlantic and worldwide.

My motive for analyzing National Oceanic and Atmospheric Administration’s (NOAA) International Best Track Archive for Climate Stewardship (IBTrACS) tropical cyclone data was not about challenging climate science, but rather a demonstration of how much high-quality, globally comprehensive climate data is available to the public for analysis.

And to confirm, to my own satisfaction, many of claims being made by climate researchers regarding tropical cyclones.

To the credit of the climate science community, they put their data online. They don’t hide it. And when they systematically adjust it for historical inaccuracies and systematic measurement errors, they document it. Climate science isn’t a secret society and they aren’t hiding anything substantive from public scrutiny.

So when critics of my storm intensity article were actual, PhD-minted climatologists, not just amateur schleps like myself, I took notice.

According to one climatologist critical of my essay, I didn’t properly convey the natural mechanisms involved in tropical cyclone development and intensification which explain why a rapidly warming earth is not experiencing dramatically stronger cyclones (yet). While I did mention how warmer oceans provide more energy for cyclone development (which is true), it is also true that higher atmospheric temperatures create more wind shear which weakens storms. Climatologists, therefore, are not surprised that tropical cyclones have not significantly increased in intensity through the present.

Another critic directed my attention to data compiled by Colorado State University (using the same IBTrACS database I used for my analysis) showing that the annual accumulated cyclone energy (which combines frequency, size and intensity measures of cyclone strength) has not increased worldwide since 1980 (see Figure 1). Again, this is not a surprise to the climate science community.

Figure 1: Global Accumulated Cyclone Energy (Annual)

Source: Colorado State University


Finally, one other critic noted that I filtered my tropical cyclone dataset down to storms with sustained winds of at least 39 knots in order to minimize missing pressure data (particularly in the North Indian Ocean basin and for storms in the 1960s); however, I did not impute missing pressure values for the remaining 12 percent of tropical cyclones that still had missing data.

The missing data issue does give me pause as it is one of my consistent complaints about many statistical analyses reported in the popular media. The problem is too important to casually wave off (as I did in my tropical cyclone analysis).

Therefore, I have gone back and re-done my analysis with three major analytic changes: (1) I did not filter out smaller storms below 40 knots, (2) I restricted my analysis to 4,224 storms from the period 1980 to 2018 in order to minimize the occurrence of missing data, and (3) where there was still missing data (12% of storms, n=526), I imputed maximum sustained wind and minimum central pressure for all IBTrACS documented storms using a multiple imputation linear regression model.

For the minimum central pressure missing data model, the predictors were basin, storm duration, and maximum sustained winds (plus random error). For missing maximum wind data, the predictor variables were minimum central pressure, basin, and storm duration (plus random error). In cases where both pressure and wind data were missing (low information cases, n=179), the imputation models included only storm duration and basin (plus random error). Where pressure or wind data were available, the imputation models predicted 90 percent of the variance. For the low information cases, the imputation model predicted just over 30 percent of the variance.

To compare the revised results, Figure 2 shows the original pressure data series with a observed trend of -0.092 mb in minimum central pressure for the average tropical cyclone.

Figure 2: Average Minimum Central Pressure (millibars) per Tropical Cyclone (Without Missing Data Imputation)


Figure 3 shows the revised data series for minimum central pressure (globally) from 1960 to 2018. The revised model — with all missing cases imputed — reveals an even steeper decline per year in average minimum central pressure (b = -0.159). This is not surprising as most of the missing cases were among smaller cyclones occurring in the 1980s.

Figure 3: Average Minimum Central Pressure (millibars) per Tropical Cyclone (With Missing Data Imputation) and linear trend regression


If this linear trend continues, by 2100, the average tropical cyclone will have a minimum central pressure almost 13 mb lower than today. As noted in my previous essay, that can be the difference between a Category 1 storm and a Category 3 storm, though factors other than pressure also impact a storm’s maximum sustained winds.

Nonetheless, according to the linear trend model in Figure 3, tropical cyclones are going to be incrementally stronger over time, assuming the generating process (such as global warming) remains unchanged.

Consistent with decreasing central pressures, maximum sustained winds per storm are also rising (see Figure 4) by 0.166 knots every year. If this linear trend continues, by 2100, the average tropical cyclone will have maximum sustained winds almost 14 knots higher than today.

Figure 4: Average Maximum Sustained Winds (knots) per Tropical Cyclone and linear trend regression


Also consistent with theory and existing research by NASA, the number tropical cyclone days — which is annually a function of the number of tropical storms multiplied by the average cyclone’s lifespan — is declining (see Figure 5). The globe is seeing 4.4 fewer tropical cyclone days each year and if this trend continues, by 2100, the globe will experience 364 fewer cyclone days each year compared to today. That will be over half of the 590 cyclone days the global experienced in 2018.

Figure 5: Tropical Cyclone Days Annually (1980 to 2018) and linear trend regression


But the IBTrACS data reveals something else. Tropical cyclones are not just getting more intense, they may also be getting bigger.

With the strong caveat that there is significantly more missing data with the storm size parameters in the IBTrACS database, an exploratory analysis of the radius of the outermost closed isobar (ROCI) and the radius of maximum winds (RMW) indicates, since 2001, tropical cyclones may be getting larger.

Though the trend does not achieve statistical significance, the average tropical cyclone’s ROCI may be growing by 1.85 nautical miles per year worldwide (see Figure 6). By 2100, the average tropical cyclone could be wider by about 155 nautical miles — about one and a half Long Islands (NY) — and almost double the size of an average tropical cyclone today.

Figure 6: Average Radius of Outermost Closed Isobar (in nautical miles)


Similarly, within the North Atlantic basin where more complete data is available in IBTrACS, the radius of maximum winds for the average storm may be growing by 0.63 nautical miles each year — more than double the RMW of an average tropical cyclone today (see Figure 7). Again, this trend is not statistically significant, but possibly indicative of a longer term trend that would be in line with current theory and forecasts regarding global warming’s impact on tropical cyclones.

Figure 7: Average Radius of Maximum Winds (in nautical miles)


What does this all mean?

First, of all the assertions made in the mainstream media about climate change, much of it inaccurate, speculative and over-dramatized, we should not discount the real changes we are witnessing in the global occurrence of tropical cyclones. These storms may be less frequent, but they are getting stronger and bigger.

Second, my analysis here is simply modeling the behavior over time of selected tropical storm metrics, not the underlying causal mechanisms generating these trends. The strong assumption accompanying this approach is that the generating process behind each trend is constant and will persist into the future. That is not likely to be the case. Global warming is not a linear process and its impact over time is not either.

Finally, this non-peer-reviewed research on my part treats tropical storms as a singular phenomenon, which is a substantial over-simplification.

“You have to remember that storms aren’t one-dimensional,” according to NASA climatologist Dr. Anthony Del Genio. “There are many types of storms, and sorting out how aspects of each type respond to warming is where the science really gets interesting.”

The real research is going on at that level and explicitly modeling the impact of a warming planet on these complex meteorological phenomena.

What I am comfortable concluding from a statistical perspective, using data vetted by the climate science community, is that tropical cyclones are changing in frequency, size and intensity. Whether these trends continue and how these trends might change are the questions challenging climate scientists going forward.

  • K.R.K.

Additional information

Good online resources for current climate science research are the following:

NASA Goddard Institute for Space Studieshttps://www.giss.nasa.gov/

AGU Publicationshttps://agupubs.onlinelibrary.wiley.com/

NOAA Climate Resourceshttps://www.noaa.gov/climate

UN Intergovernmental Panel on Climate Change (IPCC) Online Report Libraryhttps://www.ipcc.ch/reports/